
Free Shipping in the USA on nearly all items!
Limited phone hours during the Holidays! Call us: 888-611-9305
Free Shipping in the USA on nearly ALL items! Limited phone hours during the Holidays!

Seedlings need 100–300 µmol·m⁻²·s⁻¹ at canopy. Vegetative plants perform well at 400–600 µmol·m⁻²·s⁻¹. Early flower responds to 600–800 µmol·m⁻²·s⁻¹, and peak flower under ambient CO₂ targets 800–1,000 µmol·m⁻²·s⁻¹. With CO₂ supplementation at 1,200–1,500 ppm, growers can push 1,200–1,500 µmol·m⁻²·s⁻¹ without triggering stress. These are the canopy-level PPFD targets that drive results in indoor cannabis grows.
Three caveats apply across every stage:
A controlled trial published in Frontiers in Plant Science found that dry inflorescence yield increased almost linearly with canopy-level PPFD from roughly 120 to 1,800 µmol·m⁻²·s⁻¹ under ambient CO₂, with no saturation observed across that range. That finding reframes how growers should think about light. More photons at the canopy consistently produce more flower mass, up to very high intensities, as long as the environment keeps pace.
Canopy-level PPFD is the single most actionable metric in indoor cannabis lighting, and measuring it accurately with a quantum sensor is the first step every grower should take before adjusting fixture height or output.
| Point | Details |
|---|---|
| Stage-by-stage PPFD targets | Seedlings: 100–300; veg: 400–600; early flower: 600–800; peak flower: 800–1,000 µmol·m⁻²·s⁻¹ under ambient CO₂. |
| CO₂ and environment first | Pushing past 1,000 µmol·m⁻²·s⁻¹ requires CO₂ at 1,200+ ppm and canopy temps below 85°F to avoid diminishing returns. |
| Acclimate before increasing | Raise PPFD by no more than 100–150 µmol·m⁻²·s⁻¹ every 3–5 days to avoid bleaching and photoinhibition. |
| Measure uniformity, not just peak | Target a minimum-to-average PPFD ratio of 0.75 or higher across the canopy footprint. |
| LedGrowLightsDepot fixture range | Fixtures from seedling-safe Sunblaster Micro LEDs to the high-output Grower’s Choice ROI-E720 cover every stage and PPFD target. |
PPFD stands for Photosynthetic Photon Flux Density. It measures the number of photons in the 400–700 nm wavelength range (PAR, or photosynthetically active radiation) arriving at a specific point per second, expressed in µmol·m⁻²·s⁻¹. That single number tells you how much usable light is hitting your canopy right now.
It is different from three related terms growers often confuse:
PPFD is the number you act on in real time. DLI is the number you manage across the day. A plant receiving 800 µmol·m⁻²·s⁻¹ for 12 hours accumulates a DLI of 34.6 mol·m⁻²·d⁻¹.
Watts and lumens are not substitutes. Watts measure electrical input, not photon output. Lumens weight the spectrum toward human vision, which peaks in green, not the red and blue wavelengths cannabis uses most. A fixture that scores high in lumens can deliver far fewer usable photons than a lower-lumen LED tuned for plant growth. The efficiency difference between LED and HPS systems is precisely why wattage comparisons mislead growers who switch technologies.
Accurate PPFD measurement requires a quantum sensor, not a lux meter. Lux meters weight wavelengths for human vision and consistently underreport red-heavy spectra. The two most trusted calibrated instruments are the LI-COR LI-190R and the Apogee SQ-500, both used in peer-reviewed cannabis research. For budget-conscious growers, the Apogee MQ-500 and Trolmaster quantum sensors offer reliable readings at lower cost.
Pro Tip: If you run the same fixture long-term, mount a permanent sensor at a fixed canopy reference point and log it weekly. LED output degrades gradually over thousands of hours, and a logged baseline catches that drift before it costs you yield.
Common mistakes to avoid: measuring at the fixture face (always higher than canopy), using a smartphone lux app (spectrally wrong), and mapping only the center point (misses edge falloff). For practical guidance on sizing and mapping LED fixtures to your specific space, LedGrowLightsDepot’s blog covers the process in detail.
The table below summarizes practical canopy-level targets. DLI ranges are calculated from the PPFD midpoint and a typical photoperiod for each stage.
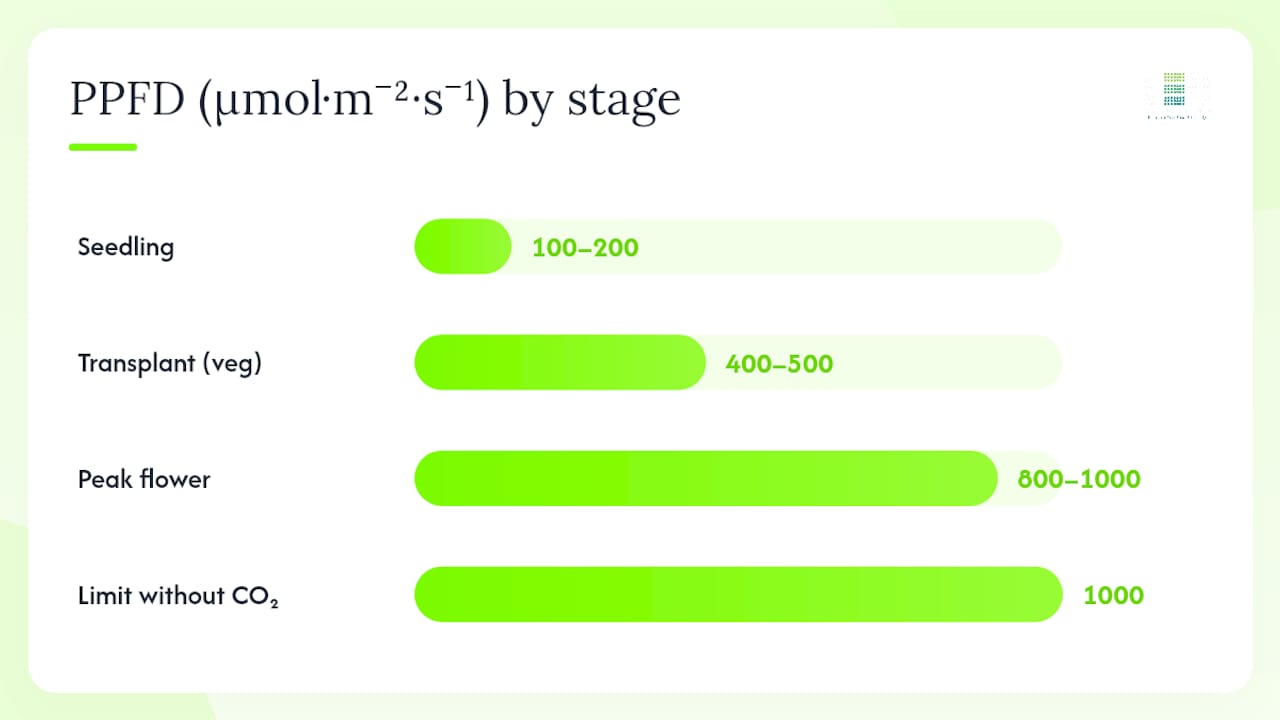
Practical grower guides consistently recommend starting seedlings at 100–200 µmol·m⁻²·s⁻¹ at germination and rising to 400–500 µmol·m⁻²·s⁻¹ by transplant. Many hobby growers run full-panel output over seedling trays and wonder why cotyledons bleach within 48 hours.
For peak flower under ambient CO₂, a practical synthesis of the Guelph research recommends 800–1,000 µmol·m⁻²·s⁻¹ as the sweet spot where most home tents can approach high yield without CO₂ supplementation. Beyond 1,000 µmol·m⁻²·s⁻¹ without CO₂, heat and carbon limitations typically offset the extra photons.
The Frontiers 2022 trial comparing 600, 800, and 1,000 µmol·m⁻²·s⁻¹ found inflorescence dry weight increased roughly 1.6× between the lowest and highest tested intensities, with no commercially meaningful change in cannabinoid potency. More photons reliably buy more mass, not stronger flower.
Three terms clarify this distinction:
Foundational plant physiology research shows that leaf-level photosynthesis saturates at lower irradiance than whole-canopy yield responses. A single leaf may saturate at 400–600 µmol·m⁻²·s⁻¹, yet the canopy as a whole continues converting extra photons to flower mass at much higher intensities. This happens because lower leaves, side branches, and shaded tissue all receive less light than the top of the canopy, so the whole-plant average stays well below the upper-leaf saturation point.
A plant grown at 600 µmol·m⁻²·s⁻¹ for two weeks has a TLI calibrated to that intensity. Jumping immediately to 900 µmol·m⁻²·s⁻¹ risks photooxidative stress, visible as interveinal bleaching or reduced Fv/Fm (a measure of photosystem II efficiency). The safer approach:
Example scenario: Moving from 600 to 900 µmol·m⁻²·s⁻¹ over 10–14 days. Day 1–4 at 700, day 5–9 at 800, day 10–14 at 900. At each step, confirm canopy temperature stays below 82°F and VPD remains in the 1.0–1.5 kPa range for flowering. This pacing lets the plant upregulate its photosynthetic machinery rather than overwhelm it.
The DLI formula is straightforward:
DLI (mol·m⁻²·d⁻¹) = PPFD (µmol·m⁻²·s⁻¹) × photoperiod (hours) × 3,600 ÷ 1,000,000
Flowering room at 800 µmol·m⁻²·s⁻¹, 12-hour photoperiod: 800 × 12 × 3,600 ÷ 1,000,000 = 34.6 mol·m⁻²·d⁻¹
Veg room at 450 µmol·m⁻²·s⁻¹, 18-hour photoperiod: 450 × 18 × 3,600 ÷ 1,000,000 = 29.2 mol·m⁻²·d⁻¹
Fixture efficacy, measured in µmol·J⁻¹, tells you how many photons you get per joule of electricity. A fixture rated at 2.7 µmol·J⁻¹ running at 720W delivers 1,944 µmol·s⁻¹ total PPF. Over a 12-hour day, that fixture consumes 8.64 kWh. If your electricity rate is $0.12/kWh, that is $1.04/day per fixture.
To calculate cost per mol of photons delivered to the canopy:
A fixture covering a 4×4 canopy efficiently may deliver 65–70 mol to the canopy per day even if its total PPF output is higher.
Pro Tip: Use your PPFD map average multiplied by canopy area and photoperiod to calculate actual delivered DLI, not manufacturer wattage. That number is what your plants actually receive, and it is the only figure worth using for ROI calculations.
Uniformity matters as much as average PPFD. A canopy averaging 900 µmol·m⁻²·s⁻¹ with a hotspot at 1,400 and corners at 400 will show light stress in the center and stretch at the edges simultaneously.
The target uniformity ratio (minimum PPFD ÷ average PPFD) should be 0.75 or higher for most cannabis setups. Below 0.70, edge plants underperform significantly relative to center plants.
2×2 tent: One compact panel (200–300W) centered 18–24 inches above canopy.
4×4 tent: One high-output bar-style fixture (600–720W) or two smaller panels with 6–8 inches of overlap. Bar fixtures typically produce better edge-to-center uniformity than single circular panels. For a comparison of bar fixtures versus panel lights in terms of distribution, LedGrowLightsDepot’s guide covers the trade-offs directly.
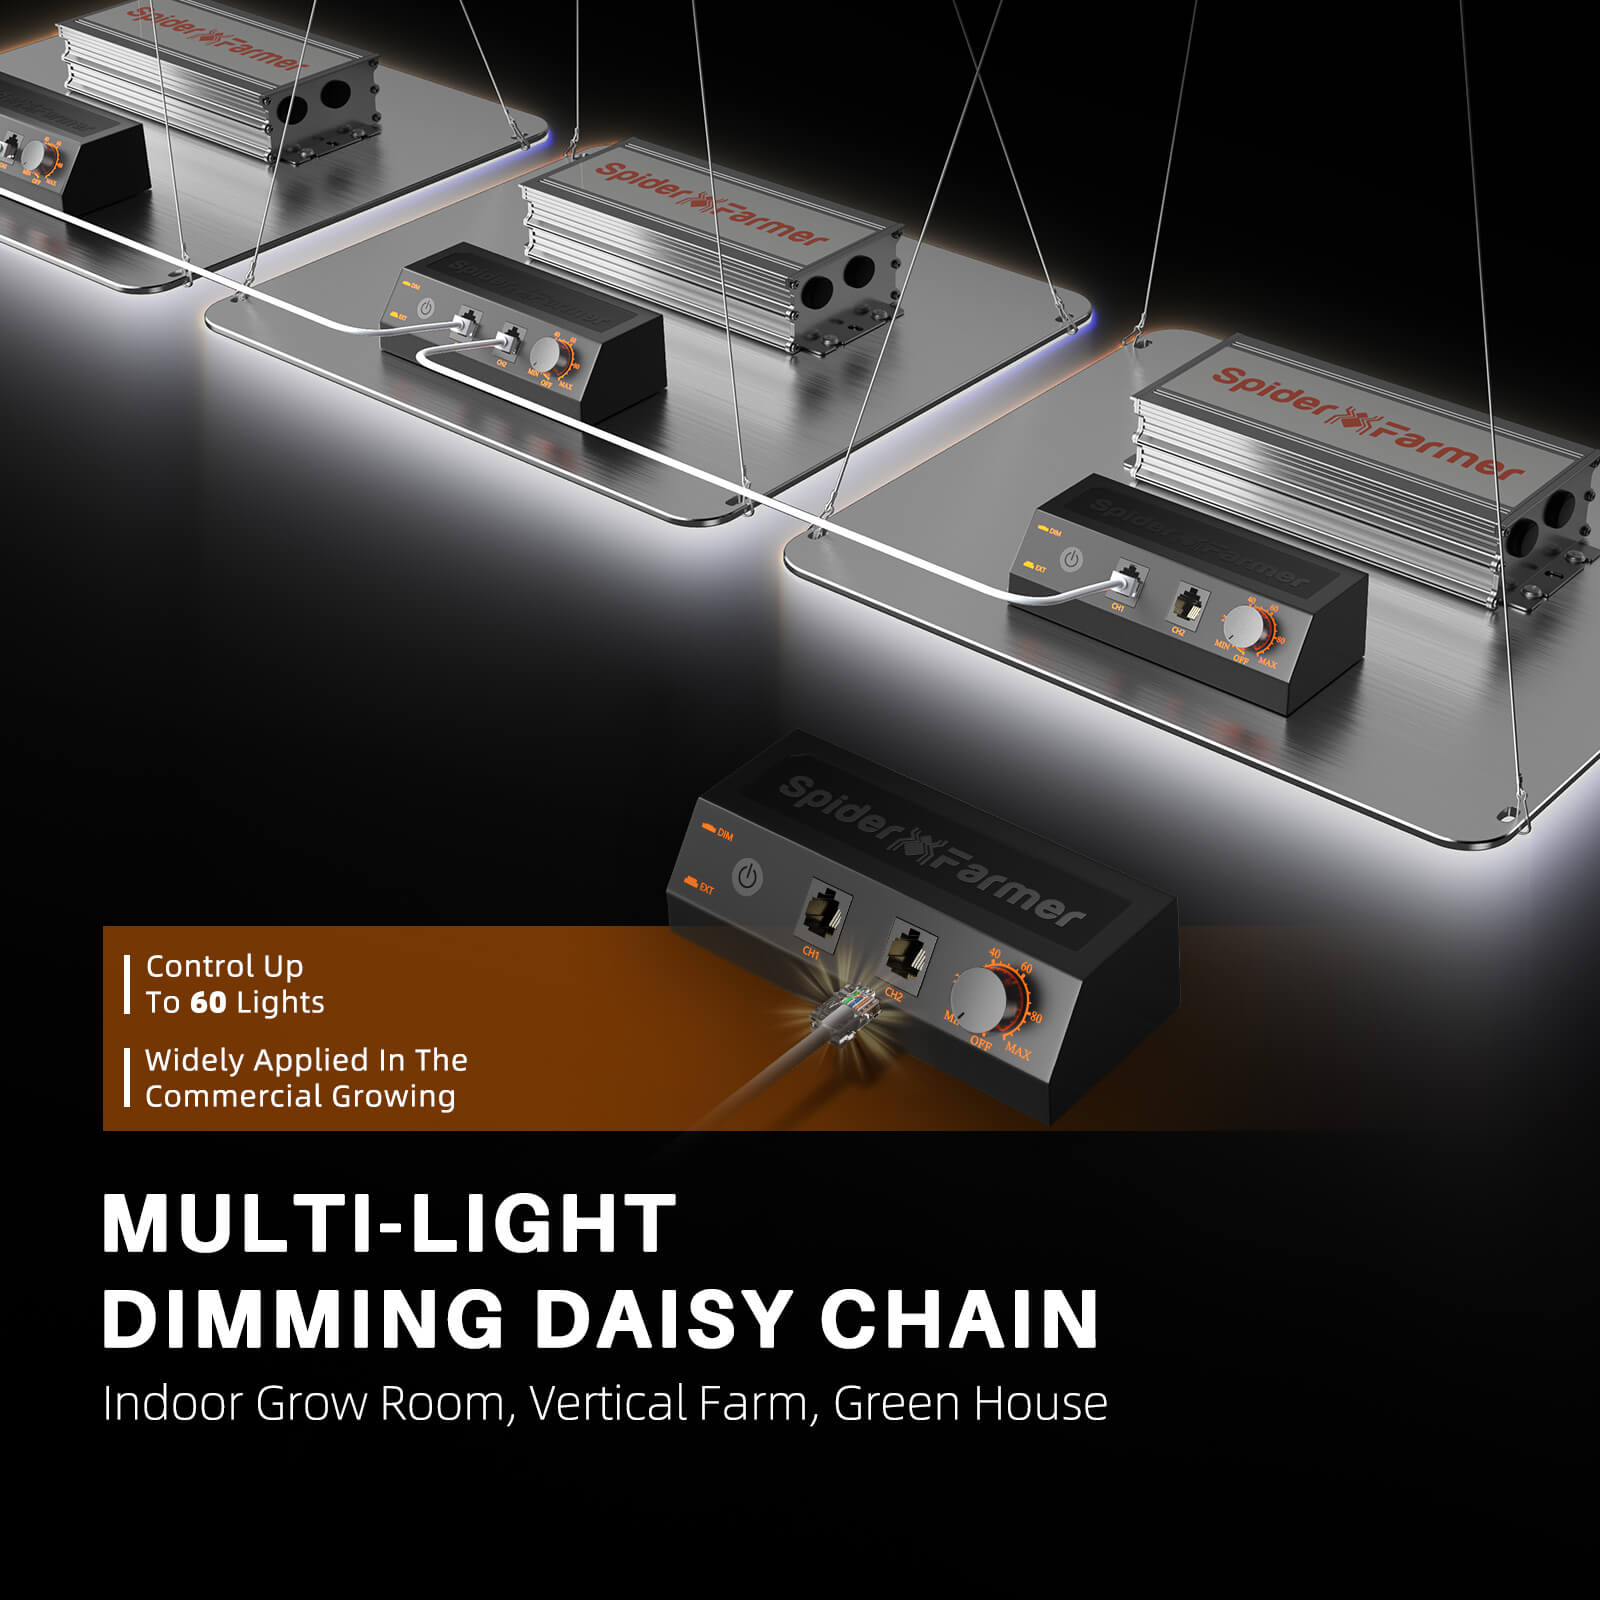
Multi-bench commercial room: Linear bar arrays spaced at 2–3 foot intervals provide the most consistent distribution. Under-canopy supplemental strips add 50–150 µmol·m⁻²·s⁻¹ to lower bud sites without raising canopy-level intensity.
The controlled-environment literature on cannabis and PPFD has grown substantially since 2020. Three findings stand out for practical decision-making.
Yield increases linearly with PPFD across a wide range. The Rodriguez-Morrison et al. 2021 trial found dry inflorescence yield rose almost linearly from roughly 120 to 1,800 µmol·m⁻²·s⁻¹ under ambient CO₂, with no yield plateau observed. Leaf-level photosynthesis saturated far earlier, confirming that canopy-scale processes, not single-leaf responses, drive flower production.
More photons increase mass, not per-gram potency. The Frontiers 2022 trial found inflorescence dry weight increased roughly 1.6× between 600 and 1,000 µmol·m⁻²·s⁻¹, but cannabinoid concentrations remained essentially unchanged across intensity treatments. Growers chasing higher THC percentages through more light will be disappointed; growers chasing more grams per square foot will not.
Dynamic lighting and cumulative photon dose shape yield and water-use efficiency. A greenhouse study published in Scientific Reports found that programs allocating more photons during flowering produced roughly 7–10% more flowers than static programs delivering the same total cumulative photon dose. This supports a practical strategy: keep veg PPFD adequate but not excessive, then ramp intensity during flower.
| Finding | Practical Implication |
|---|---|
| Linear yield response up to ~1,800 µmol·m⁻²·s⁻¹ | Higher PPFD in flower pays off in mass, limited by CO₂ and heat |
| No potency increase with higher PPFD | Extra photons buy grams, not stronger flower |
| Dynamic programs outperform static at same total dose | Ramp PPFD during flower rather than holding a flat level |
| WUE improves with higher cumulative light | Higher PPFD setups use water more efficiently per gram produced |
The economic case for pushing past 800 µmol·m⁻²·s⁻¹ depends on your electricity rate and yield premium. A useful benchmark is grams per mol of photons (g·mol⁻¹) and grams per kWh (g·kWh⁻¹). If adding 200 µmol·m⁻²·s⁻¹ costs $0.30/day in electricity and adds 3 grams per plant over a 60-day flower, the math works. If your room runs hot and you need additional cooling to handle the extra heat load, the calculation changes.
Not all cultivars respond identically to the same PPFD. Genetic background, growth architecture, and leaf morphology all influence how efficiently a plant converts photons to flower mass.
Sativa-dominant and high-vigor hybrids typically tolerate and benefit from the upper end of each stage’s PPFD range. Their open canopy architecture and higher leaf area index allow more light penetration to lower bud sites, improving whole-plant light use at higher intensities.
Indica-dominant and compact cultivars often perform well at the midpoint of each range. Dense canopies create more self-shading, so the marginal benefit of pushing from 800 to 1,000 µmol·m⁻²·s⁻¹ may be smaller than with an open-structure plant. Defoliation and canopy training become more important at high PPFD with these types.
Autoflowering varieties warrant specific attention. Autoflower light intensity targets generally sit at the lower-to-mid range for each stage. Most autoflowering cultivars perform well at 400–600 µmol·m⁻²·s⁻¹ in veg and 600–800 µmol·m⁻²·s⁻¹ in flower. Pushing autoflowers to 1,000 µmol·m⁻²·s⁻¹ without careful acclimation risks stress responses that cut into the short life cycle these plants have. Because autoflowers cannot be held in veg to recover from stress, conservative PPFD management matters more here than with photoperiod strains.
When working with an unfamiliar cultivar, start at the lower half of the recommended range for that stage and observe growth rate, internode spacing, and leaf color over 7–10 days before increasing intensity.
PPFD targets do not exist in isolation. The plant’s ability to use photons depends directly on the temperature and vapor pressure deficit (VPD) it is operating in.
Temperature and photosynthetic rate are tightly linked. Cannabis photosynthesis runs most efficiently between 77°F and 86°F at the leaf surface. Below 70°F, enzymatic activity slows and the plant cannot process photons efficiently, meaning high PPFD at low temperatures wastes light and risks stress. Above 88°F, photorespiration increases and net carbon gain drops, so pushing PPFD higher in a hot room compounds the problem rather than solving it.
VPD and stomatal conductance determine how freely CO₂ enters the leaf. At VPD below 0.8 kPa (high humidity), stomata partially close, limiting CO₂ uptake and reducing the plant’s ability to use available photons. At VPD above 1.6 kPa in flower, water stress causes stomatal closure for a different reason. The practical target for peak flower is 1.0–1.5 kPa. Within that range, stomata stay open and the plant can use the photons you deliver.
Fix the environment first, then raise the light.
Higher PPFD drives faster photosynthesis, which accelerates transpiration, nutrient uptake, and metabolic demand. Growers who raise PPFD without adjusting their feed and irrigation schedule often see deficiencies appear within 5–7 days, not because the nutrients are absent but because the plant is consuming them faster.
Transpiration and watering frequency scale with PPFD. A plant at 900 µmol·m⁻²·s⁻¹ transpires more water per hour than the same plant at 600 µmol·m⁻²·s⁻¹. In coco or rockwool, this means irrigation frequency should increase when you raise light intensity, not stay on the same schedule. Monitoring substrate moisture with a meter rather than a fixed timer becomes more important at higher PPFD.
Nitrogen and calcium demand increase with photosynthetic rate. Calcium is particularly relevant because it moves with transpiration flow. At high PPFD with adequate VPD, calcium demand rises and deficiencies can appear at the newest growth sites first. Growers pushing toward 900–1,000 µmol·m⁻²·s⁻¹ in flower should verify their calcium and magnesium levels are adequate before attributing tip burn to light stress alone.
EC and feed concentration may need modest upward adjustment when moving from mid-range to high PPFD, but the more important change is frequency and volume, not concentration. Overconcentrating nutrients to compensate for higher light is a common error that leads to salt buildup and lockout.
The research on PPFD and secondary metabolite production is more nuanced than the yield data. The short answer: higher PPFD reliably increases total flower mass but does not consistently increase per-gram cannabinoid concentration.
The Frontiers 2022 study found minimal effects on cannabinoid concentrations across 600, 800, and 1,000 µmol·m⁻²·s⁻¹ treatments. Because total flower mass increased substantially, total cannabinoid yield per plant increased with PPFD, even though the percentage per gram did not. For growers selling by weight, this is the relevant metric.
Terpene profiles show more variability. The Scientific Reports greenhouse study examined terpenes alongside yield and WUE, and found that lighting program design (dynamic vs. static) had measurable effects on some terpene fractions. The practical takeaway: if terpene expression is a priority, lighting program timing and spectrum may matter more than raw PPFD intensity.
For growers using UVA supplementation to explore secondary metabolite effects, the HLG 30 UVA LED Supplement is one option, though commercial evidence for UV increasing total potency remains limited and results vary by cultivar.
Most growers do not run too much light. They run the wrong light in the wrong place, measured with the wrong tool.
Measuring at the fixture instead of the canopy. A fixture face reading of 2,000 µmol·m⁻²·s⁻¹ at 6 inches drops to 700–900 µmol·m⁻²·s⁻¹ at 24 inches. Canopy height is the only measurement that matters.
Using a lux meter. Lux meters are calibrated for human vision. A reading of 50,000 lux from a red-heavy HPS or LED spectrum translates to a very different PPFD than 50,000 lux from a white fluorescent. The conversion factor varies by spectrum and is not reliable enough for grow room decisions.
Running seedlings at full fixture output. This is the single most common error. A 720W fixture at 18 inches delivers far more than 300 µmol·m⁻²·s⁻¹ to a seedling tray.
Chasing PPFD without fixing the environment. High PPFD in a hot, humid room does not produce high yield. It produces stressed plants. Temperature, VPD, and CO₂ availability set the ceiling for what PPFD can deliver.
Ignoring uniformity. A single center-point reading that hits 900 µmol·m⁻²·s⁻¹ does not mean the whole canopy is at 900. Edge plants at 400 µmol·m⁻²·s⁻¹ in the same tent are leaving yield on the table regardless of what the center reads.
Skipping acclimation when switching fixtures. Moving from a 400W HPS to a 720W LED and running it at full output from day one exposes plants to a PPFD they have no photosynthetic history with. Ramp over 7–10 days.
The conventional wisdom in hobby growing circles has long been that 600–700 µmol·m⁻²·s⁻¹ is “plenty” for flower. The peer-reviewed data does not support that ceiling. The Rodriguez-Morrison et al. 2021 trial showed yield rising linearly all the way to 1,800 µmol·m⁻²·s⁻¹ under ambient CO₂, which means most hobby tents are running at a fraction of what the plant can convert to flower mass.
The real constraint is not the plant. It is the environment. Heat management, CO₂ availability, and VPD control are what actually limit how high you can push PPFD profitably. Growers who invest in environmental controls before chasing higher PPFD targets consistently see better returns than those who buy a more powerful fixture and run it into a room that cannot support it.
There is also a tendency to treat PPFD targets as fixed numbers rather than ranges with decision logic inside them. The right PPFD for your grow is not a single published figure. It is the highest intensity your specific environment, cultivar, and nutrient program can support without triggering stress. That number requires measurement, not guesswork.
One practical pattern worth noting: growers who map their canopy for the first time almost always discover their average PPFD is lower than they assumed, and their uniformity ratio is worse. A 4×4 tent with a single panel often shows a center reading of 900 µmol·m⁻²·s⁻¹ and corner readings of 450–500 µmol·m⁻²·s⁻¹. The average is closer to 700, and the corners are in early-flower territory during peak flower. Fixing that uniformity problem, through fixture choice, hang height, or supplemental strips, often delivers more yield improvement than simply buying a more powerful light.
Hitting the right canopy PPFD starts with a fixture that delivers the photons where your plants actually are, not just at the center point. LedGrowLightsDepot carries fixtures matched to every stage and setup size, with the efficacy ratings and PPFD maps to verify real canopy delivery before you buy.

For seedling stations and propagation trays, the Sunblaster Micro LED Grow Light Garden (White) and Black keep intensity in the safe 100–300 µmol·m⁻²·s⁻¹ range without requiring dimming workarounds. For 4×4 flowering canopies targeting 800–1,000 µmol·m⁻²·s⁻¹, the Grower’s Choice ROI-E720 and HortiBloom Mega Eco 720 deliver high-efficiency full-spectrum output with the uniformity data to back it up. CO₂-ready rooms pushing 1,200–1,500 µmol·m⁻²·s⁻¹ can step up to the HortiBloom Mega Optic 720W, which uses lens optics to concentrate photons into dense canopies with tighter beam control. The ThinkGrow LED Model-I and Model-I Plus cover mid-range veg and early flower setups where uniform coverage across a 3×3 to 4×4 footprint matters more than peak intensity. Browse the full selection and get fixture-specific PPFD maps at Ledgrowlightsdepot.
0 of 3 items selected


Leave a comment