
Free Shipping in the USA on nearly all items!
Limited phone hours during the Holidays! Call us: 888-611-9305
Free Shipping in the USA on nearly ALL items! Limited phone hours during the Holidays!

LED depreciation, in grower terms, means the gradual loss of usable plant light — measured as PPFD (photosynthetic photon flux density) at the canopy — as your fixture ages. This is not an accounting concept. It is a physical process governed by standards like LM-80 and TM-21 from the IES, tracked by the U.S. Department of Energy, and directly tied to your yield. The single most important action you can take right now is to map your canopy PPFD with a calibrated PAR meter, record that baseline, and set a replacement threshold before output drops below your crop’s minimum requirement.
Pro Tip: Don’t rely on visual brightness to judge output. Human eyes adapt to dimming; a PAR meter does not.
LED depreciation is a physical process: your fixture loses PPFD gradually over time, and monitoring with a PAR meter is the only reliable way to protect yield before output drops below your crop’s minimum requirement.
| Point | Details |
|---|---|
| Baseline PPFD first | Map canopy PPFD at installation; every future check is meaningless without this reference point. |
| Specify L90 for flower | L70 can represent an agronomically unacceptable PPFD loss for flowering and fruiting crops. |
| Monitor on schedule | Home growers: quarterly PAR checks. Commercial operations: monthly checks with full data logging. |
| Control heat and humidity | Each 10°C rise in junction temperature roughly halves fixture lifetime; humidity accelerates decay further. |
| LedGrowLightsDepot | Carries fixtures with published LM-80/TM-21 data; team available to match Lx targets to crop needs. |
Lumens measure brightness as the human eye perceives it. PPFD measures photosynthetically active photons reaching a square meter of canopy per second, expressed in µmol·m⁻²·s⁻¹. These are not interchangeable. A fixture can still look bright while delivering measurably less plant-useful light than it did at installation.
Lx definitions growers need:
LM-80 is the IES component-level test: LED packages run at defined temperatures and currents for at least 6,000 hours, with flux measured at intervals. TM-21 takes that data and projects long-term lumen maintenance using an exponential decay model. TM-35-19 adds chromaticity tracking, identifying three phases of spectrum shift: incubation (early, minimal change), recovery (partial stabilization), and emergence (progressive drift). Spectrum drift can reduce flowering performance even before PPFD crosses a critical threshold.
Pro Tip: For high-light, light-sensitive crops in flower, specify L90 — not L70. Many spec sheets default to L70, which can represent a PPFD loss your plants will notice before your eyes do.
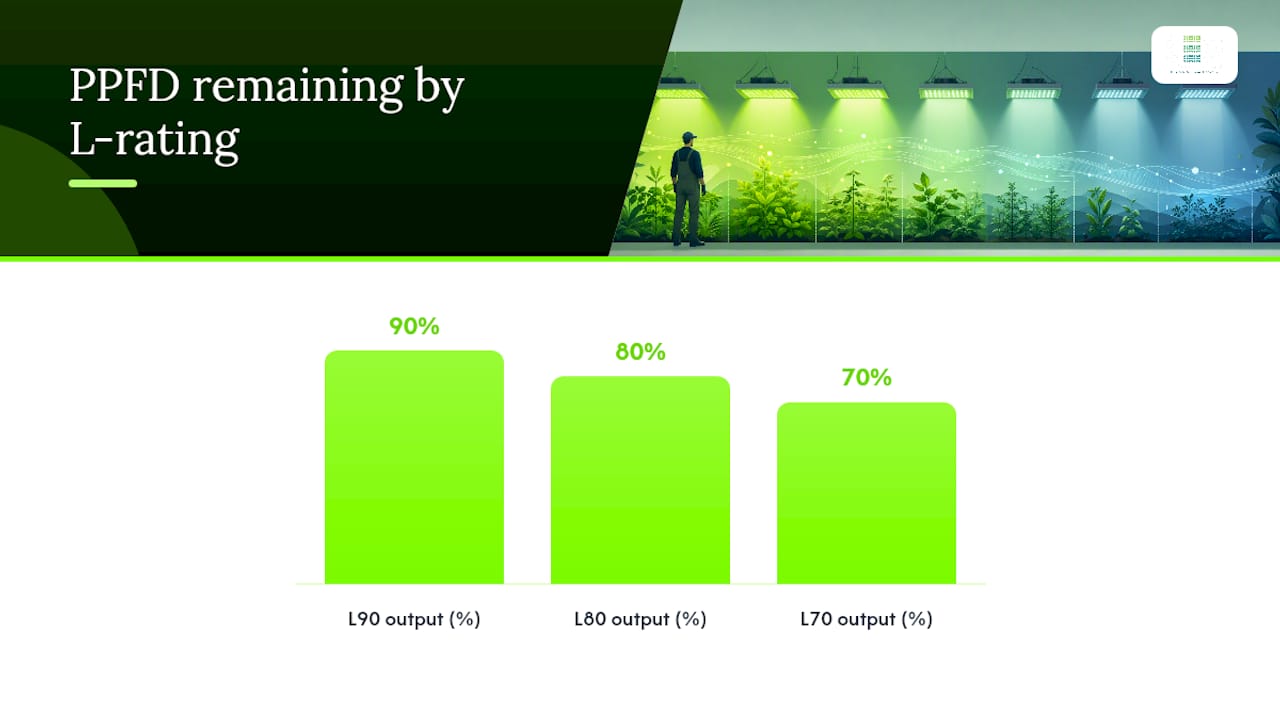
LM-80 tests measure LED package flux at controlled junction temperatures and drive currents over thousands of hours. TM-21 then fits that data to an exponential decay curve and projects forward — but only up to six times the LM-80 test duration. That is the 6× rule: if a manufacturer tested for 6,000 hours, TM-21 can project no further than 36,000 hours. Any “50,000-hour” claim beyond that limit is extrapolation, not a TM-21 projection.
What accelerated stress tests (ASTs) reveal:
Key limit: LM-80/TM-21 projections are models built on controlled lab conditions. Your actual junction temperature, room humidity, and optical cleanliness all shift the outcome.
The LED chip itself is only one part of the depreciation story. Thermal design and driver quality determine how fast the chip ages.
Pro Tip: When evaluating a fixture, check heatsink width and fin density. A fixture with a thin, narrow heatsink in a warm grow room will run hotter than its datasheet assumes, shortening usable PPFD life.
Depreciation is gradual and often imperceptible day-to-day. Scheduled PAR mapping is the only reliable way to catch it before yield suffers.
Step-by-step depreciation check:
What to log at each check:
Pro Tip: Use the same PAR meter, the same grid points, and the same time of day for every check. Swapping meters or shifting measurement positions introduces error that masks real depreciation trends.
TM-21 models lumen maintenance as an exponential decay: Φ(t) = B · e^(−αt), where Φ(t) is the fraction of initial PPFD at time t (in hours), B is the initial output fraction (typically 1.0), and α is the decay constant derived from LM-80 data.
Worked example:
Running typical daily photoperiods, 36,000 hours corresponds to several years of continuous use. Plan your replacement budget accordingly.
Replacement rules of thumb:
Overspecifying initial PPFD preserves agronomic consistency through the Lx life of the fixture. Increasing drive current to compensate for depreciation accelerates α and shortens remaining life — a trade-off worth understanding before you reach for the dimmer.
Monthly:
Quarterly:
Annually:
Operational choices that extend life:
Pro Tip: Log ambient temperature and RH alongside every PAR reading. If PPFD drops correlate with periods of higher room temperature, you have identified a thermal management problem, not just normal aging.
A lifetime number without an Lx label is not a specification. It is marketing copy.
Buyer checklist:
Red flags when reading product pages:
Premium fixtures with robust thermal paths and high-quality drivers consistently maintain PPFD closer to datasheet projections than budget panels with poor heatsink design. The difference shows up in your PAR readings within the first two years.
Most growers focus on initial PPFD at purchase and then forget about it. That is the gap where yield quietly erodes. The fixtures that hold their output longest are not always the ones with the highest initial PPFD number — they are the ones with the best thermal engineering and the most transparent test data.
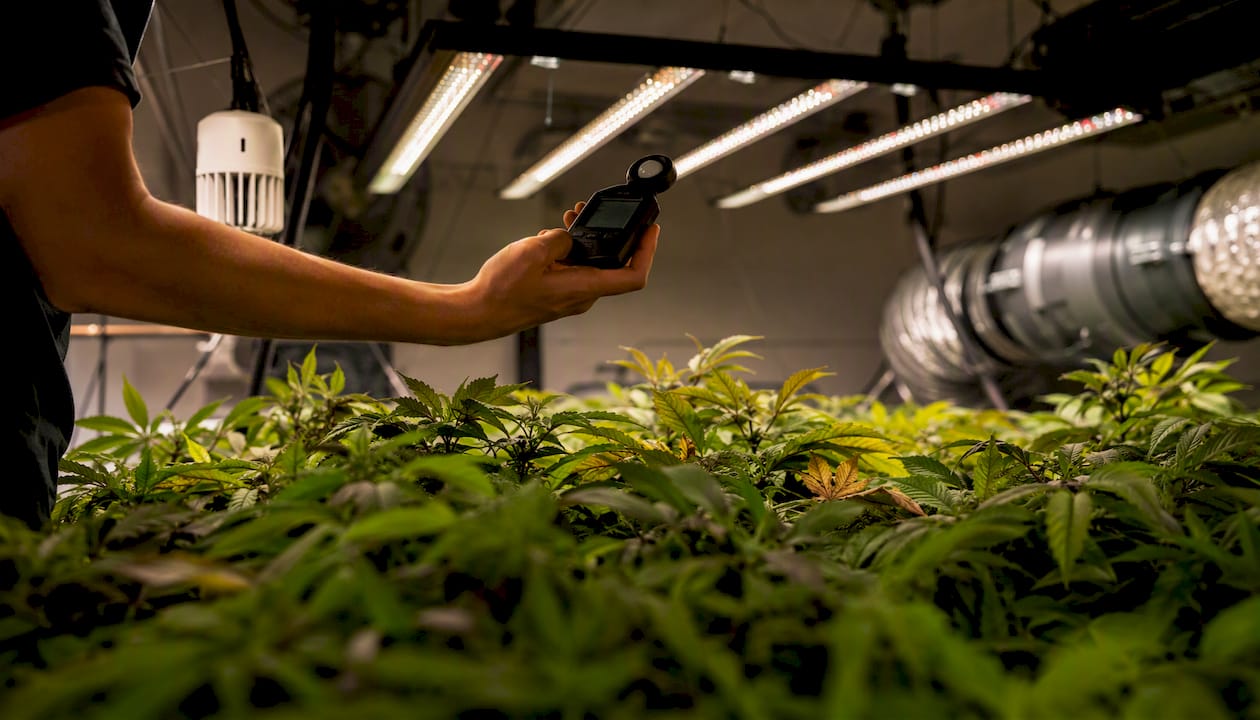
At LedGrowLightsDepot, the consistent recommendation for flowering rooms is to specify L90 and request the actual TM-21 report, not just the marketing summary. For propagation and vegetative stages, L80 is workable, and reassigning a flowering fixture that has crossed L90 to a propagation bench is a practical way to extend its useful life rather than scrapping it.
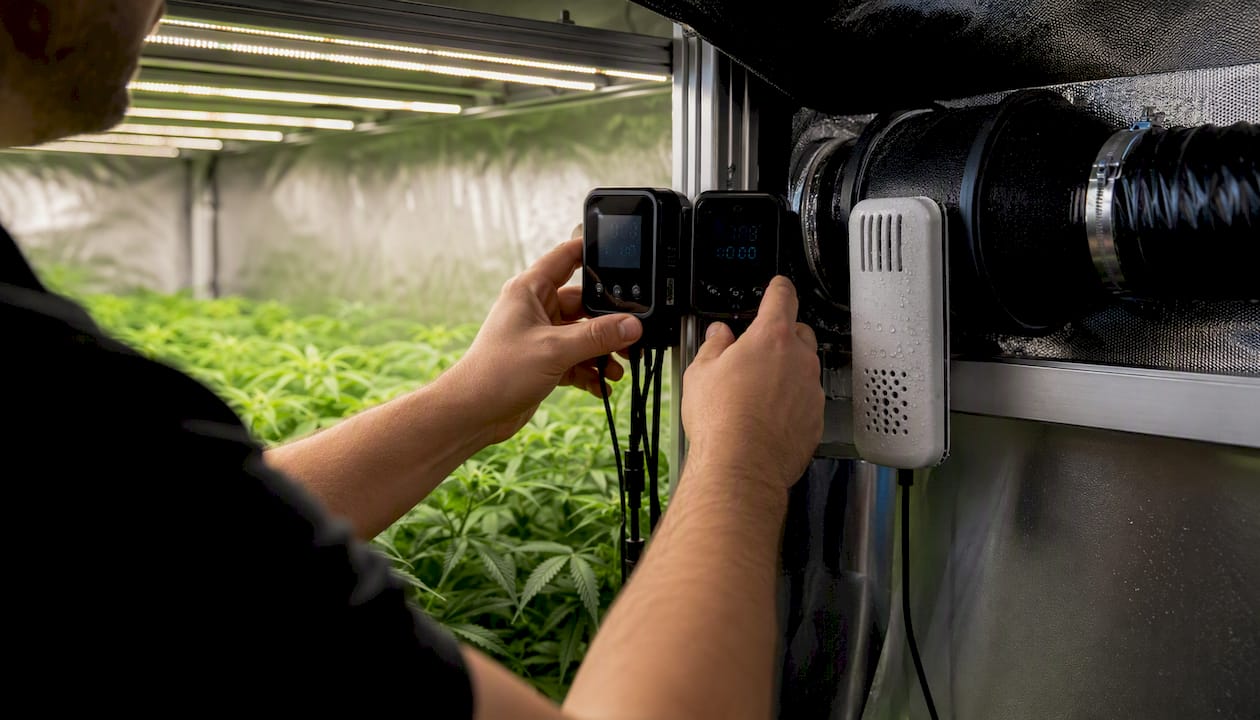
Growers who establish a baseline PAR map at installation and check quarterly catch depreciation early enough to plan replacements without emergency spending. Those who skip the baseline often discover the problem only when yield drops — at which point the fixture has been underperforming for months.
Growers who need fixtures with published LM-80/TM-21 data and thermal designs engineered for real grow room conditions will find them at LedGrowLightsDepot.
The ThinkGrow LED Model-I and Grower’s Choice ROI-E720 are two high-priority options for flowering rooms where L90 performance matters. For smaller canopies or supplemental setups, the Grower’s Choice ROI-E420 covers 4×4 footprints with the same driver quality. Contact the LedGrowLightsDepot team to request test reports, discuss Lx targets for your specific crop, or get help matching a fixture to your replacement schedule. The product pages include specification details; the team can pull LM-80/TM-21 documentation on request.
0 of 3 items selected


Leave a comment