
Free Shipping in the USA on nearly all items!
Limited phone hours during the Holidays! Call us: 888-611-9305
Free Shipping in the USA on nearly ALL items! Limited phone hours during the Holidays!

Most LED cannabis grows land between 0.5 and 1.0 grams per watt of dry flower. Optimized rooms with dialed-in environments push 1.0–1.3 g/W, and elite setups running CO₂ and precision fertigation can reach 1.3–2.0 g/W. Those numbers assume dry-trimmed weight divided by total fixture watts drawn during the run, not the rated wattage on the box.
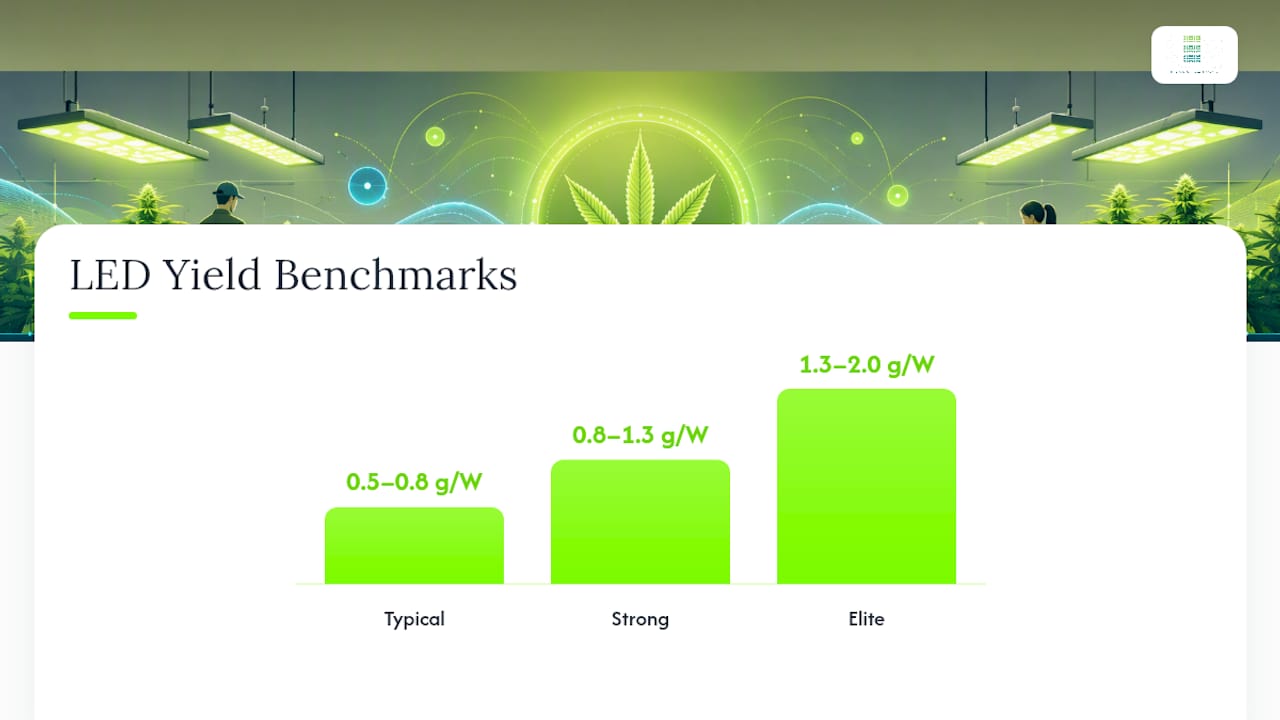
One caveat applies to every comparison you make: the calculation method matters as much as the result. Wet weight, fixture-rated watts, or ignored supplemental lights will all inflate your number and make a mediocre run look strong.
Where your grow likely sits:
Pro Tip: 1 g/W is the benchmark most experienced growers use as a practical target. Hitting it consistently means your light, environment, and nutrition are all working together.
Consistent grams per watt above 1.0 requires verified fixture efficacy, controlled canopy photon capture, and stable irrigation, not just a wattage upgrade.
| Point | Details |
|---|---|
| Benchmark ranges | Typical LED grows produce 0.5–0.8 g/W; optimized rooms reach 0.8–1.3 g/W; elite CO₂ setups can hit 1.3–2.0 g/W. |
| Measure correctly | Use dry weight divided by measured watt draw; include all lighting and log kWh if fixture power varied. |
| Prioritize photon capture | Reducing lamp-to-canopy distance and adding reflective containment can roughly double energy-utilization efficiency per the Frontiers study. |
| Log every run | Track cultivar, PPFD, DLI, watt draw, and dry grams each cycle; change one variable at a time to identify what actually moves g/W. |
| LedGrowLightsDepot | Offers verified µmol/J fixtures from ThinkGrow and Grower’s Choice, plus TrolMaster environmental and irrigation controls, to support the full optimization stack. |
Grams per watt is a straightforward efficiency metric: total dry grams harvested divided by total watts your lighting drew during the run. It tells you how well your setup converts electrical energy into usable flower, which is why it matters more than raw harvest weight alone.
Here is how the math works at common fixture sizes:
Photoperiod and crop duration also factor in. A longer vegetative period builds more canopy mass, which can raise total yield but does not automatically raise g/W if you are running more light hours to get there. The metric rewards efficiency, not just volume.
What each tier implies operationally:
Measurement errors are the most common reason growers compare numbers that cannot actually be compared. Follow this sequence to get a clean, reproducible figure.
Common errors that inflate the number:
Pro Tip: A 0.01g-resolution digital scale (like an AWS or Jennings model) gives you accurate dry-weight readings. Weigh a sample cut at 48-hour intervals until the reading stabilizes before recording your final harvest weight.
Not all variables move the needle equally. These six drivers are ranked by the size of the gain a grower can realistically capture.
Usable photons delivered to the canopy (µmol/J and PPF). A fixture’s photon efficacy, measured in µmol/J, determines how many usable photons it produces per joule of energy. Two fixtures with identical wattage can deliver very different PPF totals depending on their efficacy. According to a Nature review of horticultural LED lighting, typical achieved fixture efficacies run 2.5–3.0 µmol/J, with theoretical upper bounds near 3.4–4.1 µmol/J depending on spectrum and design. That gap between fixtures is a direct yield gap.
Crop-canopy photon capture efficiency (CCPCE). Photons that miss the canopy are wasted energy. Research published in Frontiers in Plant Science found that reducing lamp-to-canopy distance roughly doubled energy-utilization efficiency (g/kWh) at the closest tested distance versus the standard distance. Improving CCPCE is often the single largest untapped gain in a grow room.
Genetics and canopy training. High-yielding genetics with a structure suited to your fixture footprint produce more dry weight per photon absorbed. Training methods (LST, SCROG, topping) that spread the canopy evenly across the light footprint raise CCPCE and reduce shaded lower growth.
Environment: VPD, temperature, humidity, and CO₂. Plants transpire and photosynthesize within specific ranges. VPD between 0.8–1.2 kPa during flowering supports maximum stomatal conductance. CO₂ enrichment to 1,000–1,500 ppm raises the photosynthetic ceiling, but only when light and temperature are already optimized.
Nutrition and irrigation consistency. Inconsistent fertigation creates salt buildup, lockout, or deficiency cycles that reduce dry-matter accumulation. Precision drip or recirculating systems that maintain consistent EC and pH throughout the run support the steady growth rate that elite g/W requires.
Fixture placement, thermal management, and fixture age. Mounting height affects PPFD uniformity and CCPCE. Thermal management affects LED junction temperature, which directly affects µmol/J output over time. Older fixtures with degraded drivers or LEDs deliver fewer photons per watt than their spec sheet suggests.
Key signals to measure for each driver:
Work through this list in order. Higher-impact items come first. Change one variable per run and log your g/W result before moving to the next.
Pro Tip: Keep a one-page run log for every cycle. Record fixture watt draw, average PPFD, DLI, cultivar, training method, and final dry grams. After three runs with the same variable, you have a reproducible trend, not a one-off result.
These examples reflect configurations and g/W outcomes reported across grow journals and community forums. Variability in genetics and measurement method means no single report is definitive, but the patterns are consistent.
Community grow journals are useful for directional guidance, but a single reported g/W number without documented measurement method, cultivar, and dry-weight protocol is not a reliable benchmark. Reproducible results across three or more runs with consistent methodology are what separate a real data point from a forum highlight.
Genetics account for more variance than most growers expect. The same fixture, room, and environment can produce 0.7 g/W with one cultivar and 1.1 g/W with another. Log your cultivar every run.
Wattage tells you how much electricity a fixture consumes. It does not tell you how many usable photons reach your canopy. Two fixtures drawing 600W can deliver meaningfully different PPF totals depending on their LED packages, driver efficiency, thermal design, and optical losses.
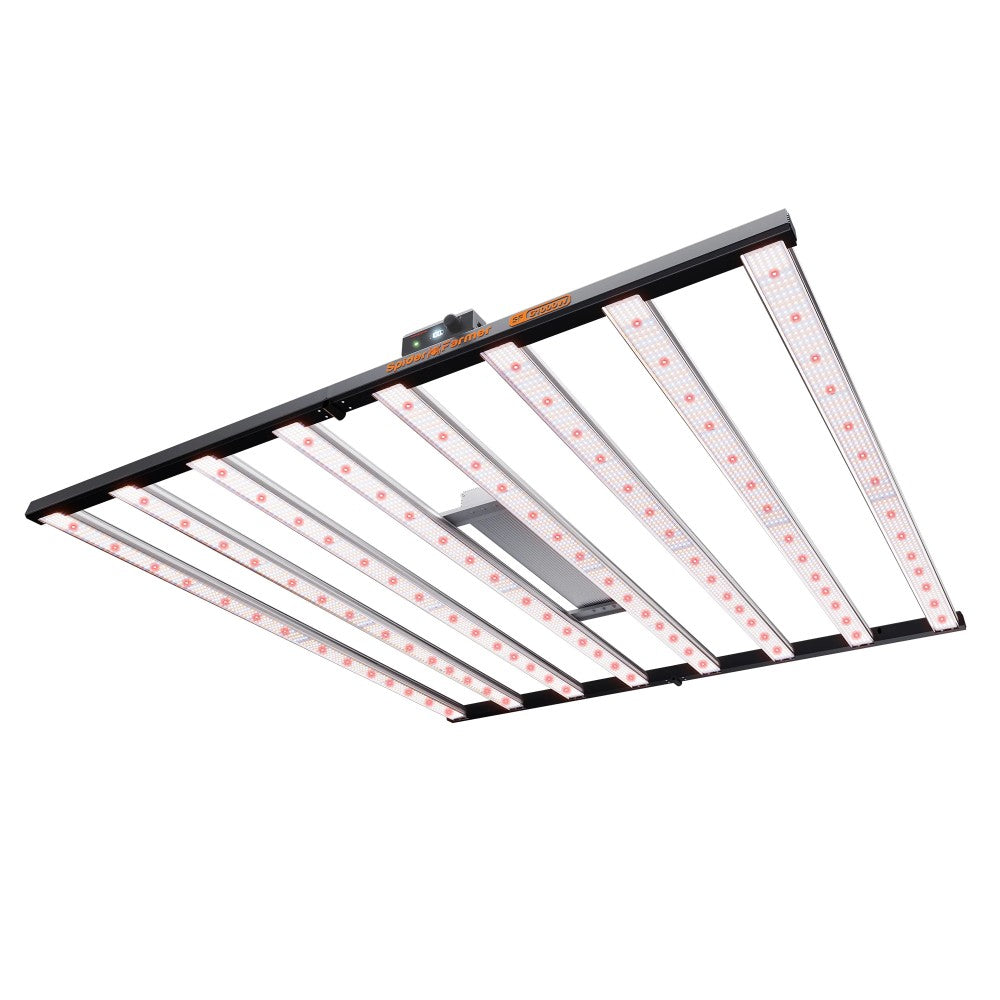
The U.S. Department of Energy explains that LED package efficacy differs from luminaire efficacy because drivers, thermal effects, and optics all reduce usable output. A fixture’s marketing spec may reflect LED package performance, not what the luminaire actually delivers at the canopy. This is why LED efficiency metrics like µmol/J and PPF matter more than lumens per watt for horticultural decisions.
Why lumens per watt misleads growers:
Key figure: The Nature horticultural LED review reports typical achieved fixture efficacies of 2.5–3.0 µmol/J, with theoretical upper bounds near 3.4–4.1 µmol/J. The gap between a 2.0 µmol/J fixture and a 3.0 µmol/J fixture at 600W is 600 µmol/s of PPF, a difference large enough to shift g/W by 0.2–0.3 points in an otherwise identical room.
Specs to request before buying any fixture:
Canopy placement compounds the fixture-efficacy difference. The Frontiers close-canopy research confirmed that reducing lamp-to-canopy distance substantially increases CCPCE, and that reflective containment amplifies the gain further. A lower-efficacy fixture mounted close with reflective walls can outperform a higher-efficacy fixture mounted too high with open walls.
When your primary goal is improving grams per watt, the buying decision comes down to verified photon output, not marketing claims. Here is a practical checklist for evaluating any fixture.
Questions to ask before purchasing:
Pro Tip: Use the light output estimate calculator to convert a fixture’s µmol/J and watt draw into expected average PPFD for your canopy area before you buy. Plug in your canopy dimensions and a realistic utilization factor (0.7–0.8 for a well-contained tent) to get a realistic PPFD estimate.
Fixtures available at LedGrowLightsDepot that fit different room sizes and goals:
For multi-fixture commercial rooms, confirm that the manufacturer can supply matched replacement units and that driver components are serviceable. A fixture that cannot be matched or repaired two years from now creates operational risk.
A single harvest number tells you what happened. A log across multiple runs tells you what works. This routine gives you reproducible data to act on.
Metrics to record every run:
Experiment design for systematic improvement:
Simple run log columns:
The TrolMaster Hydro-X Environmental Control System logs PPFD, temperature, humidity, and CO₂ continuously, which removes the manual measurement step and gives you a complete environmental record for each run. Pairing it with the TrolMaster Aqua-X Pro automates irrigation scheduling and EC delivery, two of the variables that most commonly introduce run-to-run inconsistency.
The biggest g/W improvements rarely come from the fixture. They come from what happens between the fixture and the plant.
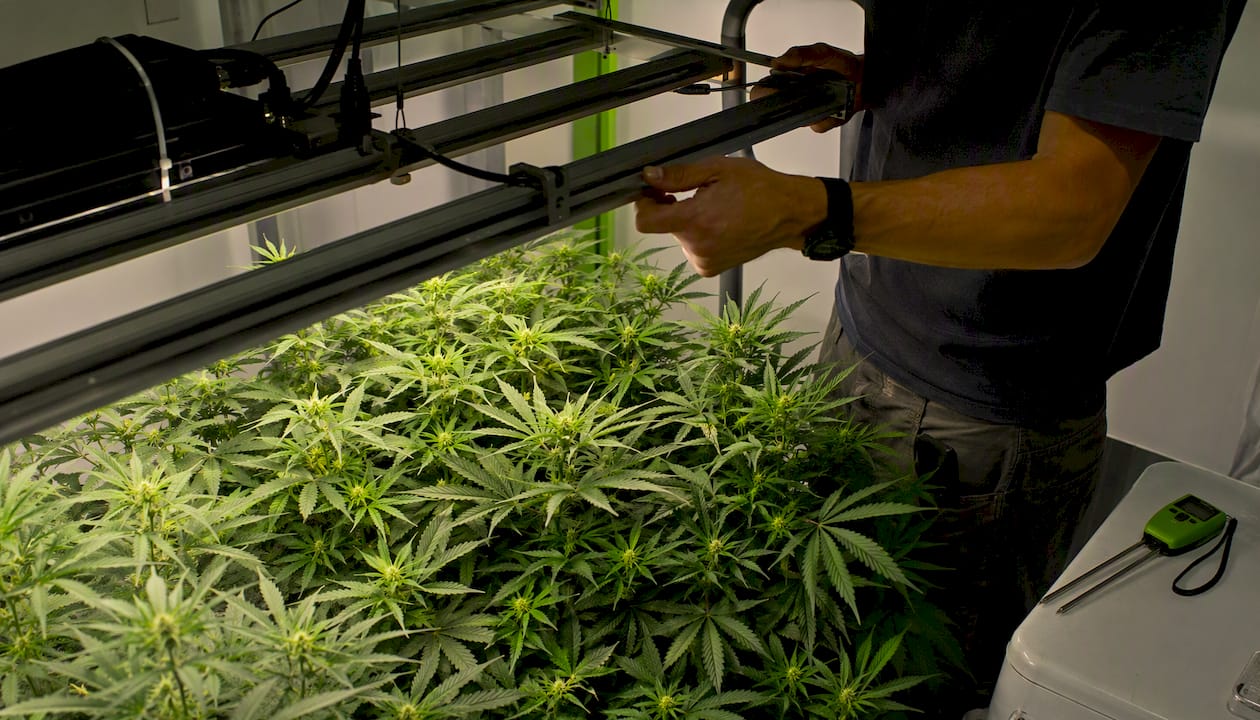
Canopy photon capture is where most grows lose the most efficiency. Fixing those three things costs almost nothing and often moves g/W by 0.2–0.3 points before you touch anything else.
Irrigation is the second underrated lever. Manual watering introduces inconsistency that compounds across a run. Two plants in the same room, watered by hand at different times or volumes, will produce different dry weights. Automated irrigation with consistent EC and pH removes that variable entirely, and the g/W gain from that consistency is reproducible across every run.
CO₂ is where growers often invest too early. Enrichment to 1,200–1,500 ppm raises the photosynthetic ceiling, but only when your PPFD is already above 800–1,000 µmol/m²/s and your temperature is in the 82–88°F range that CO₂ enrichment requires. Adding CO₂ to a room running 600 µmol/m²/s at 75°F produces a fraction of the potential gain. The cost-to-benefit ratio for CO₂ is poor until light and environment are already dialed. Spend on canopy training, reflective containment, and irrigation automation first.
Growers who have worked through the optimization checklist and are ready to upgrade their hardware have a direct path at LedGrowLightsDepot. The fixture lineup covers every room size, from the Grower’s Choice ROI-FF 650W for 4×4 flowering tents to the Grower’s Choice ROI-E720 for large commercial rooms, with verified µmol/J specs and PPFD maps available for each. Every fixture page includes the photon data you need to run the calculations in this article before you buy.

Environmental and irrigation controls from TrolMaster are stocked alongside the fixtures, so you can build the full system, lighting, environment, and fertigation, from one source. LedGrowLightsDepot carries over 5,800 verified customer reviews and a 4.8/5 satisfaction rating. Compare µmol/J and PPFD maps across the product pages, then contact the team for guidance on matching a fixture to your canopy size and g/W target.
0 of 3 items selected


Leave a comment