
Free Shipping in the USA on nearly all items!
Limited phone hours during the Holidays! Call us: 888-611-9305
Free Shipping in the USA on nearly ALL items! Limited phone hours during the Holidays!

A typical LED cannabis grow produces between 0.5 and 1.0 grams per watt, optimized rooms push into the 1.0 to 1.3 range, and elite setups running CO2 supplementation can approach 1.3 to 2.0 g/W under ideal conditions. If your numbers sit below 0.5, something in your setup is capping output well before the light ever becomes the bottleneck.
Grams per watt (g/W) measures dry harvest weight against total electrical wattage consumed by your lighting. It’s the fastest way to judge whether an LED grow light is actually earning its keep. Before you spend money on a new fixture, check these levers first:
The number only means something if you measure it consistently: dry grams, not wet, and wattage pulled at the wall, not the number printed on the box.
Grams per watt improves fastest when canopy uniformity, environment, and irrigation are fixed before any lighting upgrade, since these three factors set the ceiling every fixture has to work within.
| Point | Details |
|---|---|
| Know your benchmark band | Average grows land 0.5 to 1.0 g/W; optimized rooms hit 1.0 to 1.3 g/W; elite CO2 rooms reach 1.3 to 2.0 g/W. |
| Measure inputs correctly | Use dry cured grams and wattage measured at the wall, never rated fixture wattage. |
| Fix non-light factors first | Canopy training, VPD control, and irrigation consistency usually unlock more yield than a new fixture. |
| Track cost per gram | A 0.8 to 1.1 g/W improvement on identical wattage can cut electricity cost per gram by roughly 26%. |
| Upgrade fixtures strategically | LedGrowLightsDepot’s under-canopy proximity systems and high-efficacy fixtures like the ROI-E900 help growers move from average to optimized once fundamentals are dialed. |
Grams per watt led calculations are simple on paper: total dry grams harvested, divided by total watts your lighting draws from the outlet. That second part trips up more growers than you’d expect, because a fixture’s rated wattage and its actual wall draw under dimming rarely match exactly.
Here are two worked examples:
A few measurement habits keep your numbers honest:
Not every grow should aim for the same number. Your realistic target depends on fixture quality, canopy fill, and how tightly you control environment, and treating a commercial benchmark as a hobby-tent goal just sets you up for disappointment.
Poor or entry-level: below 0.5 g/W. This band usually points to cheap fixtures with inflated wattage claims, poor spectral output, or a canopy that’s mostly empty space under the light footprint. Growers using budget blurple panels without matched PPFD often land here even with decent technique elsewhere.
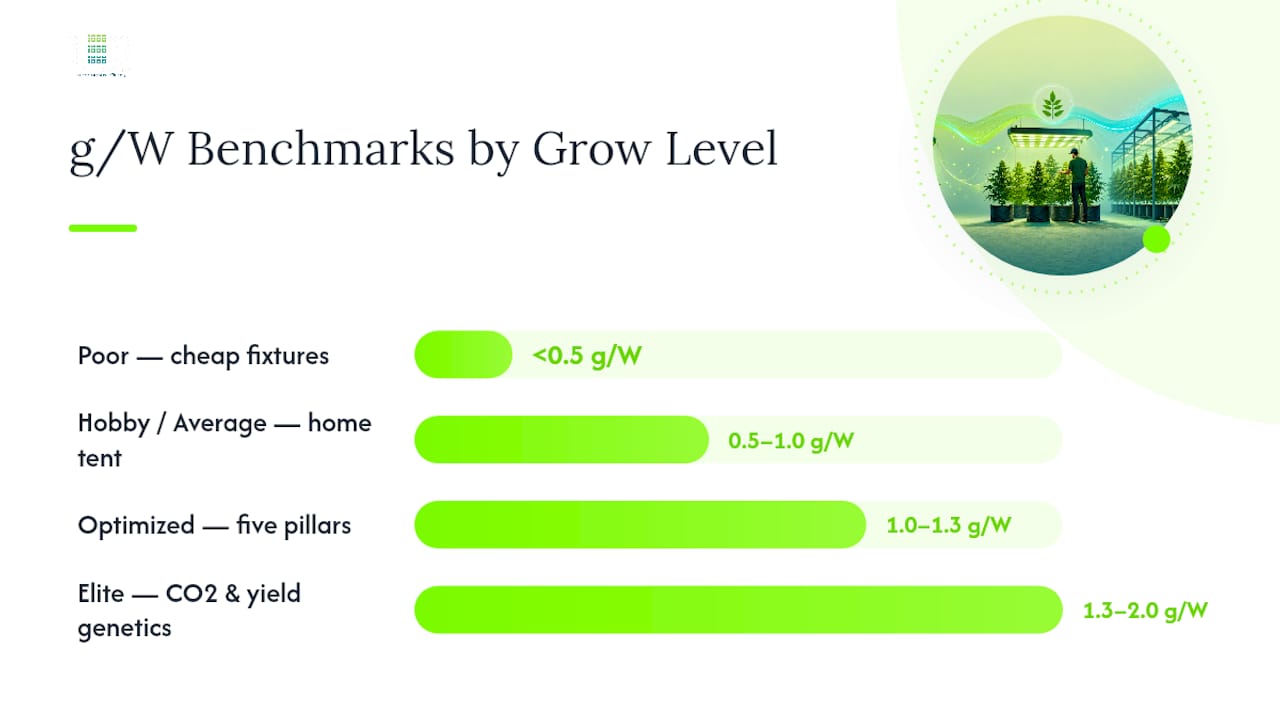
Hobby or average: 0.5 to 1.0 g/W. This is where most home LED grows land, and it’s a genuinely respectable outcome for a single tent with basic environmental control. Decent fixture, reasonable training, no major environmental disasters.
Optimized or serious: 1.0 to 1.3 g/W. Hitting this range consistently requires the alignment growers in the industry describe as the five pillars: light, nutrition, environment, irrigation, and root-zone management. Miss one pillar and the other four won’t compensate for it.
Elite or commercial: 1.3 to 2.0 g/W. This band typically requires CO2 enrichment, tightly dialed VPD, high-efficacy fixtures with strong uniformity, and genetics selected specifically for yield density rather than terpene profile or bag appeal alone. Community grow reports occasionally cite figures above 2.0 g/W, but treat those as outliers rather than a realistic planning target, since sampling bias in forum posts skews toward the best runs, not the median ones.
Pro Tip: Pick your benchmark based on what you’re actually optimizing for. A commercial operator chasing 1.5 g/W to hit margin targets makes very different equipment and CO2 investments than a hobby grower who’s happy at 0.8 g/W and values simplicity over marginal gains.
Lighting gets blamed for low yields more than it deserves. In most underperforming rooms, the light is only part of the problem, and sometimes not even the biggest part.
Lighting-specific factors set the ceiling on what’s possible:
Non-light factors determine whether the plant can actually use what the light provides:
If you’re diagnosing a room that’s underperforming, work through this priority order:
A g/W number is only useful if you can trust the inputs, and that means a repeatable protocol rather than a one-time napkin calculation at harvest.
Follow this sequence for a clean measurement:
Worked example: A commercial room runs four 640W fixtures (2,560W total measured draw) for a 63-day flowering cycle at 12 hours per day. The room yields 2,944 grams dry after cure. That’s 2,944 ÷ 2,560 = 1.15 g/W, comfortably in optimized territory.
Keep a simple tracking setup:
Tools like a DLI-based lighting controller can automate part of this logging, which matters more than it sounds like once you’re tracking multiple rooms or comparing runs months apart.
Not every improvement costs the same, and the biggest early gains rarely come from buying a new light. Work through these in order, starting with what’s nearly free.
Low-cost, high-impact fixes:
Moderate-cost upgrades:
Higher-cost, high-return investments:
PPFD targets during flower typically run from 600 to 900 µmol/m²/s for most cultivars without CO2, and up to 1,000 to 1,200 µmol/m²/s in CO2-enriched rooms. Growers running below 500 µmol/m²/s in flower usually see the average-band results (0.5 to 0.8 g/W); pushing into the 700 to 900 range with good uniformity is where most optimized rooms land their 1.0+ g/W numbers.
Pro Tip: Don’t chase PPFD past what your genetics and canopy training can use. Dumping more light onto an untrained, sparse canopy just raises your electric bill without moving the needle on g/W, since photons landing on empty space between plants are wasted regardless of intensity.
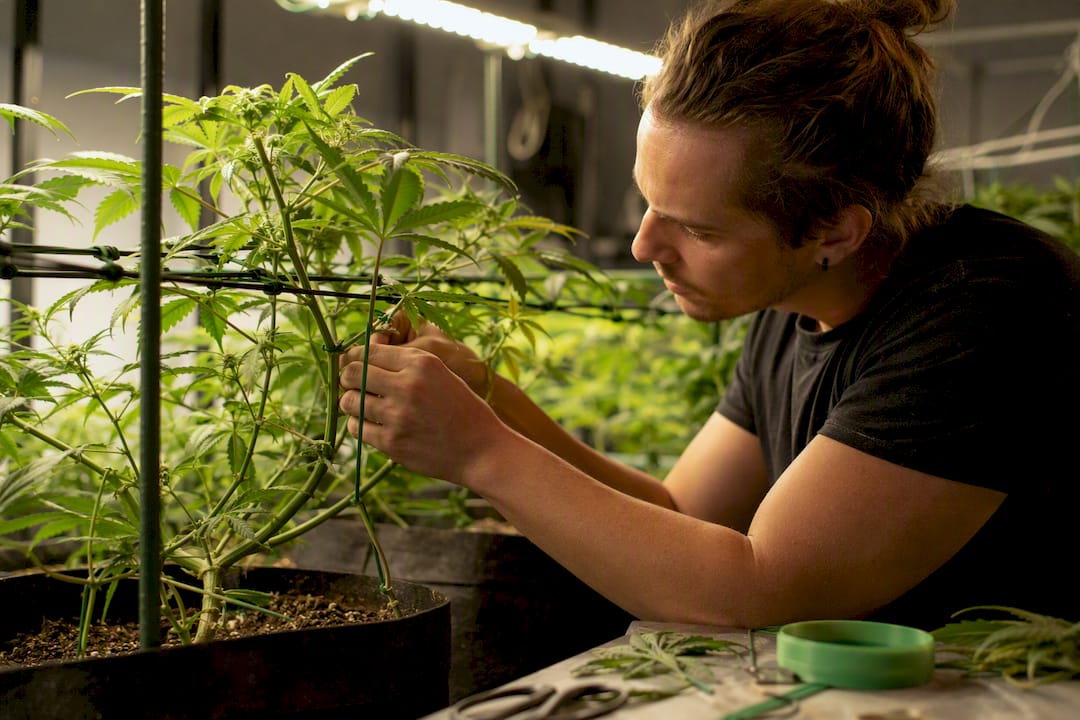
A few tradeoffs worth planning around: higher-efficacy fixtures generate less heat per photon delivered, but thermal management still matters for driver longevity and diode depreciation over years of use. And once genetics or canopy architecture become your limiting factor, no amount of additional light or CO2 will move g/W meaningfully. That’s the point where you fix the plant, not the fixture.
Running a 200W LED fixture for 12 hours a day across a 63-day flowering cycle burns 151.2 kWh (200W × 12 hours × 63 days ÷ 1,000). At $0.14 per kWh, a common US residential rate, that’s roughly $21.17 in electricity for the flowering cycle alone.
If that same fixture produces 160 grams dry (a 0.8 g/W result), your electricity cost per gram works out to about $0.13. Push efficiency to 1.1 g/W with the same wattage and grams rise to 220, dropping cost-per-gram to roughly $0.096.
Here’s the worksheet:
A jump from 0.8 to 1.1 g/W on identical wattage cuts electricity cost per gram by roughly 26 percent, without buying a single new fixture.
Cost-per-gram is sensitive to both your local electricity rate and run length, so a grower paying $0.22/kWh will see meaningfully different numbers than one paying $0.10/kWh on the same fixture and same yield.
Consistent benchmarking depends on measuring the same way every time: watts pulled at the wall, dry cured grams (never wet weight), and a documented environment that didn’t swing wildly mid-run. Sample results below reflect typical outcomes reported across grow logs and fixture specifications at varying optimization levels.
Community-reported numbers vary more widely than published fixture specs suggest. Some growers post results above 2.0 g/W, but collected grow reports suggest most LED rooms land between 0.5 and 1.5 g/W depending on how dialed the environment and training actually are, with outlier posts often reflecting best-case single plants rather than full-room averages.
A few caveats matter when comparing your numbers to anyone else’s:
Use benchmarks as a directional guide, not a strict pass/fail test.
Most growers chasing better grams-per-watt numbers start in the wrong place. They shop for a new fixture before fixing the canopy underneath the one they already own. In practice, the most reliable yield gains come from three unglamorous fixes: uniform canopy coverage so no wattage goes to waste, thermal management that keeps driver output stable over months instead of degrading mid-cycle, and irrigation precision tight enough that root stress never becomes the limiting factor.
A few things worth testing on your next run:
Most of the g/W gains covered above come from technique, not equipment. But once canopy training, environment, and irrigation are dialed, the fixture itself becomes the limiting factor, and that’s where LedGrowLightsDepot’s proprietary under-canopy proximity systems close the gap that standard top-down lighting leaves open. Under-canopy supplementation activates lower bud sites that a single overhead fixture can’t reach efficiently, which is a documented driver of yield gains above 20% and improved bud grading for growers who’ve made the switch.
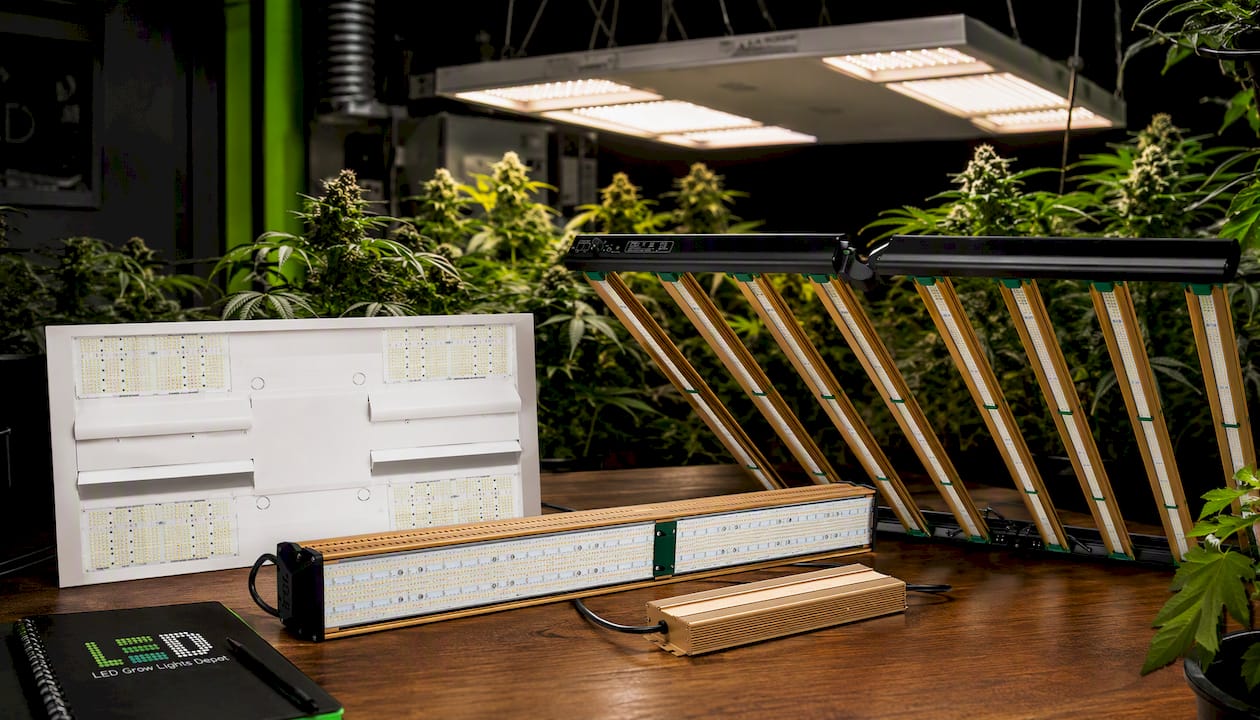
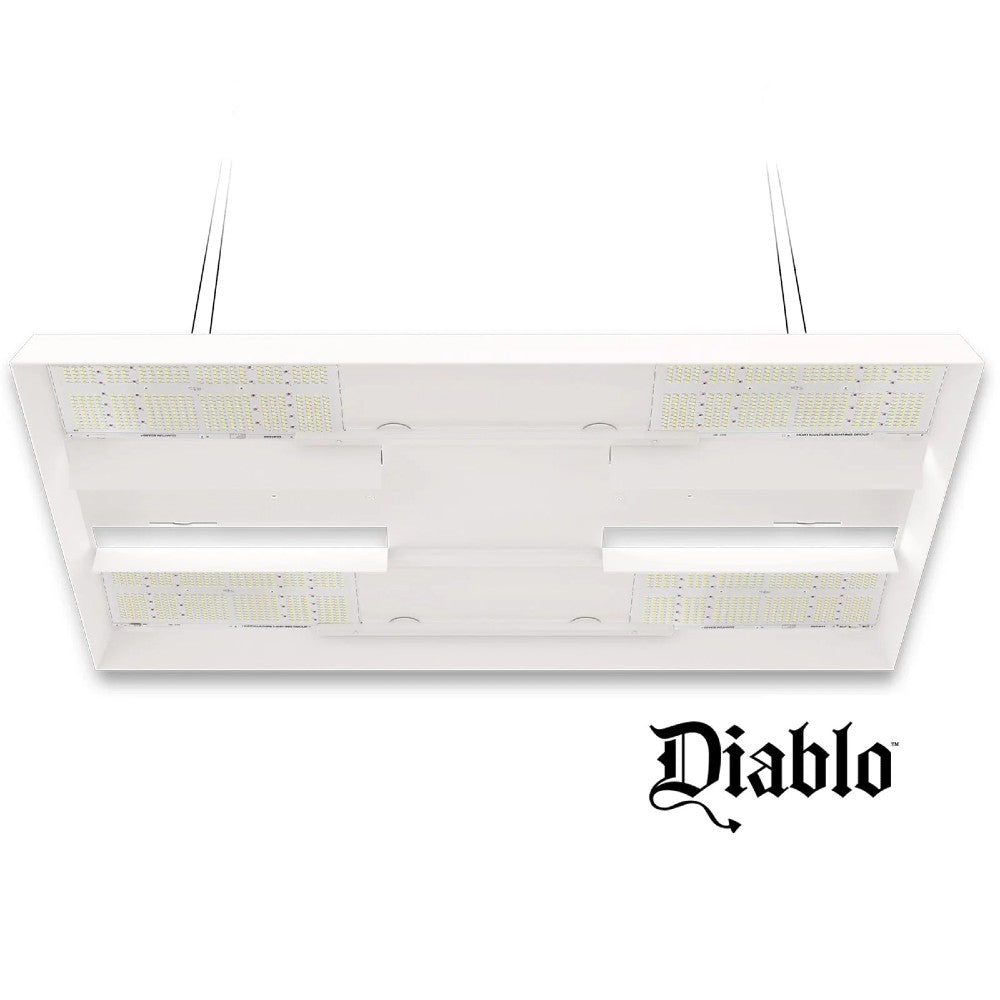
If you’re running an entry-level panel and stuck under 0.7 g/W, a fixture upgrade like the Grower’s Choice ROI-FF 650W built for 4x4 flowering spaces delivers the efficacy and uniformity that low-cost panels can’t match. Commercial operators targeting elite-band results should look at the Grower’s Choice ROI-E900 for larger footprints, while growers wanting to fill lower canopy gaps can start with a Sunblaster Micro LED Grow Light Garden for propagation and under-canopy support. With a 4.8 out of 5 rating across more than 5,800 reviews, LedGrowLightsDepot’s team can help you match fixture and system to your room size and target yield band. Browse the full catalog at LedGrowLightsDepot to find the setup that fits your next run.
What is a good grams per watt for LED grow lights?
A good grams per watt led result falls between 1.0 and 1.3 for an optimized indoor room. Anything above 1.3 typically requires CO2 supplementation and tightly controlled environment.
Is 1 gram per watt realistic for a beginner grower?
It’s achievable but not guaranteed for a first grow. Most beginners land in the 0.5 to 0.8 g/W range while dialing in training, environment, and feeding schedules across their first few cycles.
Does higher wattage always mean higher yield?
No. Uniformity, spectrum, and canopy training determine how efficiently that wattage converts to flower. A well-tuned 400W setup can outperform a poorly managed 800W room on g/W.
How do I measure LED efficiency for my own grow?
Measure watts at the wall with a plug-in power meter, weigh dry cured flower on a calibrated scale, and divide total grams by total measured wattage across the full cycle.
Does under-canopy lighting actually improve grams per watt?
Yes, in most cases. Under-canopy supplementation activates lower bud sites that overhead-only fixtures light poorly, adding harvest weight without a proportional wattage increase.
0 of 3 items selected


Leave a comment