
Free Shipping in the USA on nearly all items!
Limited phone hours during the Holidays! Call us: 888-611-9305
Free Shipping in the USA on nearly ALL items! Limited phone hours during the Holidays!

PPFD per watt measures how many photons of usable light actually reach your canopy for every watt of electricity a fixture consumes, and it matters more than wattage because two lights pulling the same power can deliver wildly different canopy intensity. A fixture rated at 2.5 µmol/J and one rated at 1.6 µmol/J will produce very different results at the same wattage.
The relationship boils down to one core equation:
PPF (µmol/s) = watts × efficacy (µmol/J), then PPFDavg = (PPF × utilization) / canopy area.
A few rules of thumb make this practical fast:
Getting real canopy PPFD per watt right requires measuring at canopy height with a quantum meter, not trusting spec-sheet efficacy claims alone.
| Point | Details |
|---|---|
| Core formula | PPF (µmol/s) = watts × efficacy (µmol/J), then divide by canopy area and multiply by utilization for PPFDavg. |
| Efficacy benchmark | Modern full-spectrum LEDs run 2.5 to 2.9 µmol/J; high-efficiency bars reach 3.0 to 3.5 µmol/J. |
| Measurement tool | Use a quantum PAR meter and average nine to sixteen grid points across the canopy for an accurate reading. |
| Uniformity over peak | A lower average with tight uniformity typically beats a high peak PPFD with dead zones. |
| Fixture selection | LedGrowLightsDepot’s ROI-E720, ThinkGrow Model-I Plus, and under-canopy Sunblaster units cover most efficacy and canopy-fill needs. |
Before you can calculate anything, you need to separate five terms that get used interchangeably online but mean different things on a spec sheet.
| Term | Unit | What it tells you |
|---|---|---|
| PPF | µmol/s | Total photon output of the fixture |
| PPFD | µmol/m²/s | Photon intensity at a specific canopy point |
| DLI | mol/m²/day | Cumulative daily photon dose |
| Efficacy | µmol/J | Photons produced per unit of electricity |
| Watts | W | Raw electrical draw |
A 600 watt fixture rated at 2.7 µmol/J produces 1,620 µmol/s of PPF. Where that PPF lands, and how concentrated it is once it spreads across your canopy, is what turns into your measured PPFD.
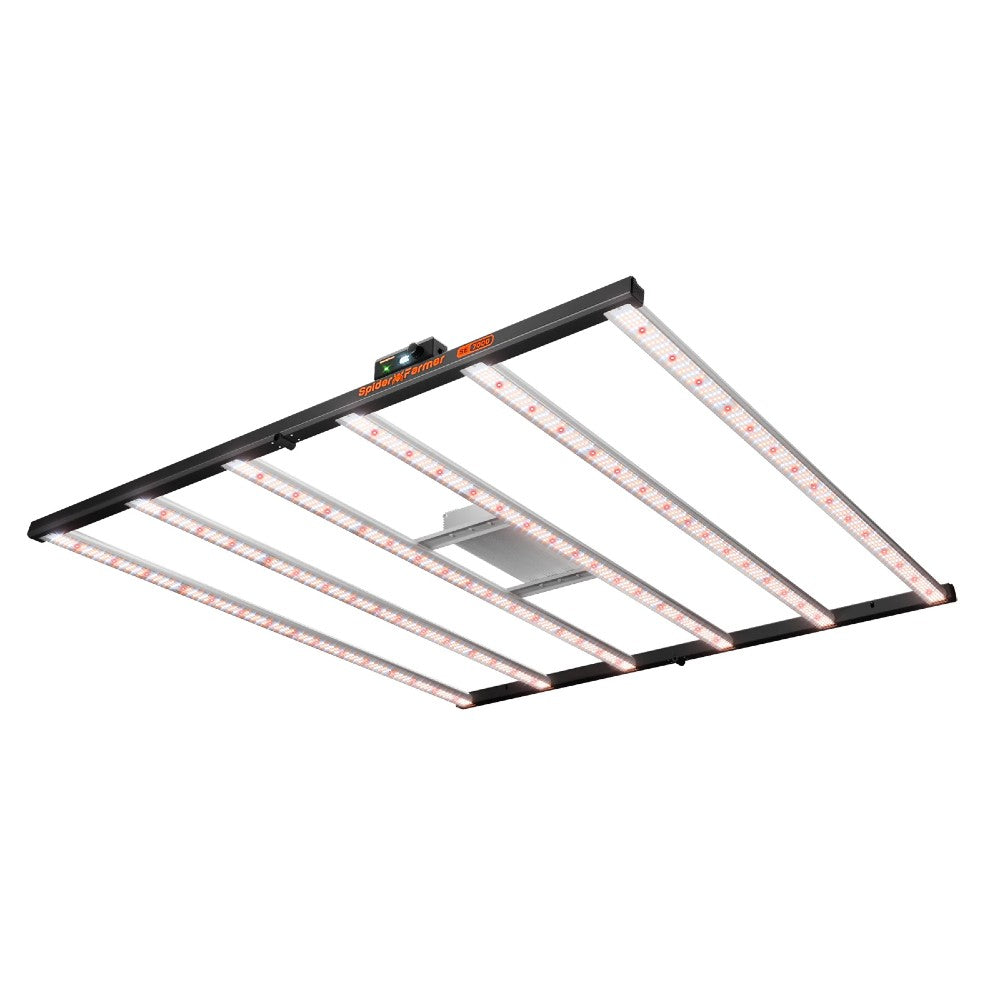
Wattage tells you what a fixture pulls from the wall.
Manufacturer spec sheets muddy this further. Driver losses, heat sink inefficiency, and lens absorption all eat into the gap between “rated wattage” and “delivered PPF.” System-level losses at the driver and luminaire stage are well documented in solid-state lighting efficiency research, and they explain why a fixture’s claimed efficacy on paper rarely matches its measured output in a real tent. Beam angle and reflector design then determine how that PPF spreads, or concentrates, across your canopy footprint.
Pro Tip: Watch for spec sheets that advertise “efficacy” using peak diode binning numbers rather than measured whole-fixture output. If a company won’t publish PPF alongside efficacy, treat the efficacy number as marketing, not measurement.
You don’t need a lighting degree to run these numbers. Three formulas cover almost every situation you’ll face when sizing a room or comparing two fixtures.
Here’s a worked example using a 4x4 foot flowering canopy (16 square feet, or about 1.5 m²):
Say your fixture pulls 630 watts and is rated at 2.6 µmol/J. PPF = 630 × 2.6 = 1,638 µmol/s. PPFDavg = (1,638 × 0.70) / 1.5 = 764 µmol/m²/s. Divide that by the fixture’s wattage and you get roughly 1.21 PPFD per watt at the canopy, a genuinely strong result for a flowering setup.
Quick checklist for running this yourself:
For a shortcut on how many watts your specific room needs, LedGrowLightsDepot has a detailed breakdown of watts per square foot that walks through the same math with different canopy sizes.
Spec-sheet math gets you a planning estimate. A quantum meter gets you the truth. The two often disagree, and when they do, trust the meter.
Pro Tip: Take your grid readings at the same time of day and after your dimmer has been at its working setting for at least 15 minutes. Fixtures on some drivers ramp brightness slightly as they warm up, and a cold reading will undersell your real output.
No fixture delivers flat, uniform PPFD across a canopy. Corners run darker than the center, and edges of your beam angle taper off faster than most growers expect.
Practical fixes worth trying before you buy anything new: lower the fixture a few inches and remeasure, add a supplemental under-canopy light to fill shaded lower zones, and switch from a single center-mounted unit to two units spread across the tent footprint.
Pro Tip: Chasing the highest possible peak PPFD reading in one hotspot usually backfires. A canopy averaging 800 µmol/m²/s with tight uniformity typically outperforms one with a 1,200 peak and a 400 dead zone, because bud development tracks the average dose, not the best square inch.
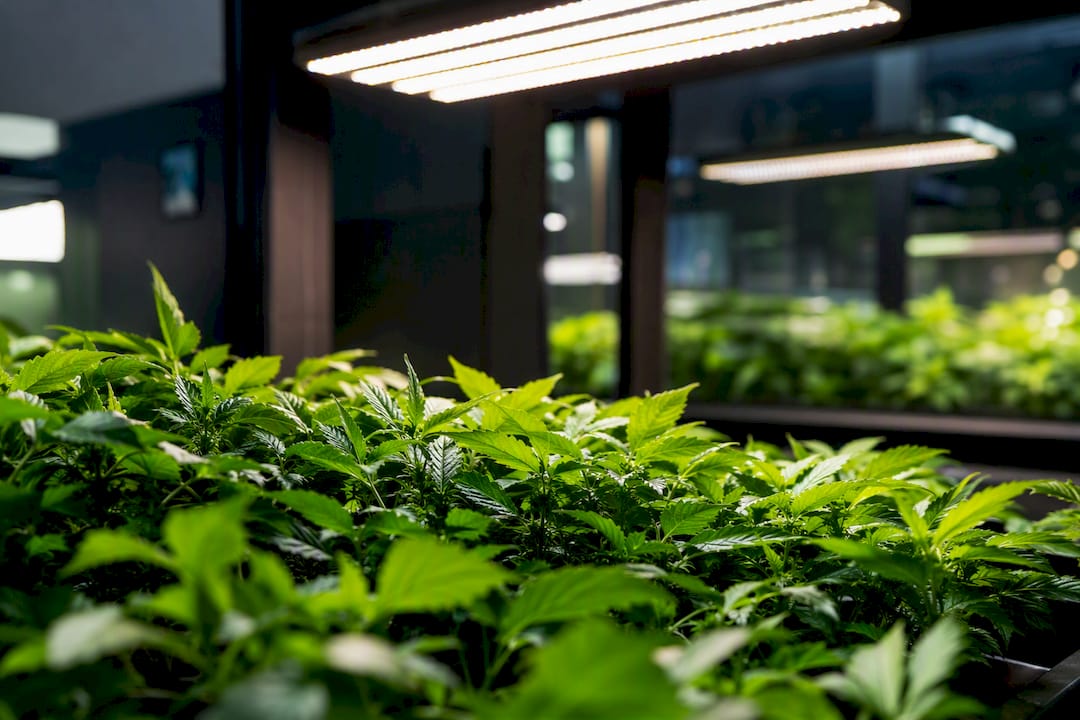
Your PPFD-per-watt calculation only means something once you know the target you’re aiming for. These ranges come from established stage-based PPFD and DLI guidance for cannabis and common horticultural crops.
| Stage / crop | PPFD range (µmol/m²/s) | Typical DLI (mol/m²/day) |
|---|---|---|
| Cannabis seedling | within a lower PPFD range | a modest DLI |
| Cannabis vegetative | within moderate PPFD levels | typical DLI for vegetative growth |
| Cannabis flowering | within higher PPFD levels | elevated DLI for flowering |
| Leafy greens | moderate PPFD range | typical DLI for leafy greens |
| Fruiting crops (tomato, pepper) | 400 to 600 | 20 to 40 |
A worked DLI example: a canopy running 500 µmol/m²/s for a 16 hour photoperiod produces roughly 28.8 mol/m²/day, a solid vegetative-to-early-flower dose depending on the crop.
Keep in mind these ranges assume adequate CO2, nutrients, and temperature. Push PPFD past 900 without raising CO2 above ambient levels and you risk light saturation, where extra photons stop translating into extra growth. Cultivar genetics shift the ceiling too. Some cannabis phenotypes plateau earlier than others regardless of how much light you throw at them. LedGrowLightsDepot’s stage-by-stage cannabis lighting guide breaks these targets down further by week.
Fixture-class benchmarks give you a reality check against marketing claims. Older “blurple” LEDs typically run 1.4 to 1.9 µmol/J, entry-level white boards sit around 2.0 to 2.4, modern full-spectrum fixtures land in the 2.5 to 2.9 range, and high-efficiency bars push 3.0 to 3.5.
| Fixture class | Efficacy (µmol/J) | Approx. watts/ft² for 800 PPFD flowering |
|---|---|---|
| Legacy “blurple” LED | 1.4–1.9 | 65 to 80 |
| Entry white LED | 2.0–2.4 | 50 to 60 |
| Modern full-spectrum LED | 2.5–2.9 | 40 to 50 |
| High-efficiency bar | 3.0–3.5 | 30 to 40 |
Photon efficacy on a spec sheet and delivered PPFD at the canopy are two different measurements taken at two different points in the system. The gap between them is where most fixture disappointments happen, and it’s exactly why a quantum sensor at canopy level tells you more than any spec sheet ever will.
When your meter reads lower than your spreadsheet predicted, work through this order before assuming your fixture is defective.
PPFD per watt is the right tool for comparing two fixtures on paper, but it’s the wrong tool for finishing your setup. I’ve seen growers buy the “better” spec-sheet number, then mount it too high and undercut every gain the efficacy rating promised. Measure at canopy height before you trust any number, spec sheet or otherwise.
Sizing a room around PPFD per watt gets a lot easier when you’re choosing from fixtures with published, verifiable efficacy numbers instead of guessing at marketing claims.

For flowering benches needing serious canopy PPFD, the Grower’s Choice ROI-E720 and the ROI-FF 650W 4x4 flowering fixture both deliver high efficacy at the wattage growers actually run. Smaller tents or multi-tier racks fit better with the Grower’s Choice ROI-E420 or the higher-output ThinkGrow LED Model-I Plus, while the standard ThinkGrow LED Model-I covers mid-size vegetative and flowering spaces. For filling shaded lower bud sites, the Sunblaster Micro LED in white or black works as compact under-canopy or micro-garden supplementation. If you’d rather measure than estimate, the TrolMaster Hydro-X quantum sensor gives you continuous PPFD readings instead of a one-time spot check. Browse the current lineup and get a sizing recommendation for your canopy at LedGrowLightsDepot.
What is a good PPFD per watt for a cannabis flowering room?
Below 0.7 typically signals an older, less efficient diode design.
Does higher wattage always mean more PPFD?
No. A lower-wattage fixture with better photon efficacy can outperform a higher-wattage fixture with cheaper diodes and a poorly designed driver.
Can I convert lux readings to PPFD accurately?
Only roughly. Lux meters are calibrated to human vision, not chlorophyll absorption, so converting to PPFD introduces meaningful error depending on the fixture’s spectrum. Use a quantum PAR meter for any reading you plan to act on.
How do I convert PPFD to DLI?
Multiply PPFD by your photoperiod in seconds, then divide by 1,000,000. A quicker field version uses DLI = PPFD × hours × 0.0036.
Why does my measured PPFD not match the spec sheet estimate?
Utilization losses, mounting height, dimmer settings, and dust on the lens all cut into delivered output. Work through the troubleshooting order above before assuming the fixture itself is underperforming.
Use the extension and Biology Insights links for definitions and standards; use the calculator links for hands-on sizing math.
0 of 3 items selected


Leave a comment