
Free Shipping in the USA on nearly all items!
Limited phone hours during the Holidays! Call us: 888-611-9305
Free Shipping in the USA on nearly ALL items! Limited phone hours during the Holidays!

The role of lighting uniformity in commercial grows is straightforward: uneven photon distribution across your canopy creates uneven plants, and uneven plants cost you money. This is not a secondary concern after intensity. Horticultural lighting scientists consistently rank uniformity as equally important as raw PPFD output for crop consistency and yield optimization.
Lighting uniformity describes how evenly photosynthetic photon flux density (PPFD) is distributed across the growing surface. When that distribution is tight, every plant in your facility receives roughly the same daily light integral (DLI), develops at the same rate, and reaches harvest at the same time. When it is not, you get a facility full of plants at different stages, drying out at different rates, and requiring labor-intensive sorting before they can move to market.
Industry-standard targets call for canopy PPFD uniformity within ±10–15% of the mean, with a coefficient of variation (CV) below 15%. In sole-source indoor environments, unmanaged intensity variance between zones frequently exceeds 50%. That gap between where most facilities operate and where they need to be is where yield losses accumulate.
Good lighting uniformity in commercial grows delivers:
Quantifying uniformity requires more than a single PPFD reading at canopy center. Three metrics matter most in commercial practice.
PPFD mapping with quantum sensors is the baseline method. You place a calibrated quantum sensor at a grid of points across the canopy plane, typically on a 6-inch to 24-inch grid depending on fixture mounting height, and record readings at each position. The tighter the grid, the more accurately you capture hot spots and dark zones. Manufacturer models often provide point-by-point PPFD values at consistent spacing, and growers should request this data rather than accepting a single peak PPFD figure.

Coefficient of variation (CV) expresses variability as a percentage of the mean. The formula is: CV = (standard deviation of PPFD readings ÷ mean PPFD) × 100. A CV below 15% is the accepted commercial threshold. The lower the CV, the tighter the distribution.
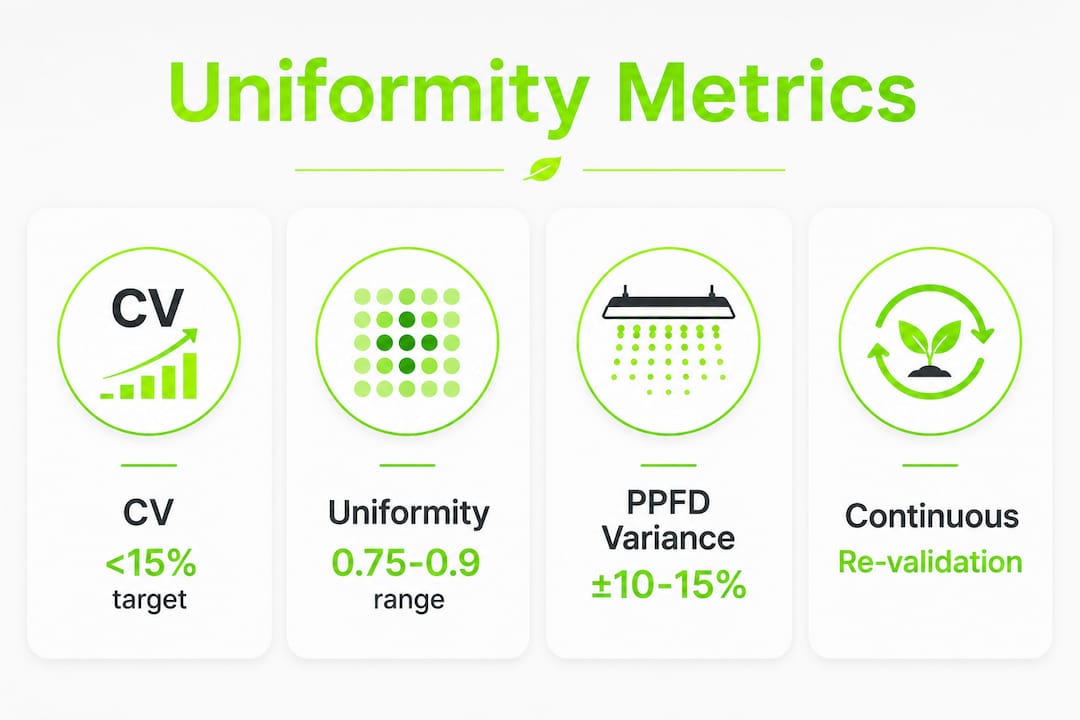
Uniformity ratio (Emin/Eavg) divides the minimum recorded PPFD by the average. Industry targets sit between 0.75 and 0.90. A ratio below 0.75 signals that your layout needs redesign before yield losses become measurable.
| Metric | Formula | Target range | Action threshold |
|---|---|---|---|
| CV | (SD ÷ Mean PPFD) × 100 | Below 15% | Above 20%: redesign layout |
| Uniformity ratio (Emin/Eavg) | Min PPFD ÷ Avg PPFD | 0.75–0.90 | Below 0.75: layout redesign needed |
| PPFD variance from mean | (Max – Min) ÷ Mean × 100 | ±10–15% | Above ±20%: fixture repositioning required |
The traditional minimum-to-average ratio has real limits. Research shows it fails to capture the full distribution shape, particularly when a small number of extreme low or high readings skew the result. Full-grid PPFD heatmap mapping, which plots every measurement point as a color-coded value, gives you a far more complete picture of where your canopy is underserved. Pair this with grow room light mapping protocols to build a repeatable baseline you can track over time.
The steps for a rigorous uniformity audit:
Spatial variation in PPFD drives differences in individual plant development, and those differences compound across a production cycle. Plants under higher light intensities photosynthesize faster, use water faster, and develop faster. Plants in darker zones lag behind. By week three or four, you are managing two effectively different crops in the same facility.
Poor uniformity causes yield reductions of 10–30%, alongside visible growth inconsistencies and increased operational complexity from sorting and grading. The economic hit is not just from lower total biomass. It comes from the labor required to handle non-uniform product and from crop value lost when plants fail quality inspection thresholds.
Yield reduction from poor uniformity: 10–30%. Spatial PPFD variation below the light saturation point directly reduces the commercial value of the crop, with the largest losses occurring when a hard quality acceptance threshold is applied.
Spectral uniformity compounds the problem. Research on photon irradiance distribution demonstrates that uneven distribution of specific wavebands across the canopy, not just total PPFD, drives differences in biomass and crop quality. A facility where blue and red ratios shift from one bench position to another will see cultivar-specific growth responses that are difficult to diagnose without spectral mapping. For cannabis cultivation, where uniform light management directly affects bud density and cannabinoid consistency, spectral uniformity is as operationally critical as intensity uniformity.
Flowering timing in photoperiod-sensitive crops is particularly vulnerable. If photoperiodic lighting is not uniform and some zones receive intensity below the plant perception threshold, flowering becomes asynchronous across the facility. That alone can push harvest windows weeks apart.
Fixture selection is the first lever. Linear bar-style LED fixtures produce a wider, more diffuse beam pattern than traditional panel lights, which makes overlapping coverage easier to achieve without creating intense hot spots directly beneath each unit. Bar fixtures versus panel lights is not just a form-factor preference; it is a uniformity decision.
Mounting height and fixture spacing are the two variables growers most often get wrong. Raising a fixture increases the illuminated area but reduces intensity. The practical target is a 10–15% beam overlap between adjacent fixtures, which fills the gaps between units without creating excessive intensity peaks. Simply adding more fixtures without adjusting spacing creates hot spots and worsens the CV rather than improving it.

Reflective surfaces contribute more than most growers expect. Research on spatial light distribution shows that indirect light from walls and ceilings accounts for 35–65% of preferred lighting ratios in interior environments. In a grow room, white or highly reflective wall surfaces redirect photons back into the canopy from angles that direct fixtures cannot reach, filling in edge zones and reducing the Emin/Eavg gap. More on maximizing this effect is covered in reflective wall strategies for controlled environments.
Practical uniformity improvement checklist:
Pro Tip: Before purchasing fixtures, request IES photometric files from the manufacturer and run them through DIALux or equivalent photometric software. A simulation that shows a CV of 12% at your target mounting height will save you from discovering a CV of 22% after installation.
Vertical farm geometry introduces obstructions that flat-room simulations miss. Vendor-specific IES files and photometric simulations account for walkway positions, rack uprights, and irrigation infrastructure that all affect where photons actually land. Post-installation validation is not optional. LED lumen output depreciates at roughly 3–5% annually, and a layout that passed its initial uniformity audit may drift below the CV threshold within a few production cycles without re-validation.
The commercial standard in US horticulture holds firm at ±10–15% PPFD variance from the mean and CV below 15%. What has shifted in recent research is the methodology used to verify compliance. The traditional minimum-to-average PPFD ratio, long used as a quick proxy for uniformity, is now widely criticized by horticultural lighting scientists for its insensitivity to distribution shape. A facility can pass a min-to-average check while still harboring significant dark zones that the ratio simply averages away.
Full-grid PPFD heatmap analysis has emerged as the preferred validation approach. It connects directly to economic modeling: research on photon irradiance and crop commercial value shows that when a hard quality acceptance threshold is applied at 80% of target PPFD, the difference between two lighting installations can shift crop yield utilization from 99% to 46%. That is not a marginal difference. It is the difference between a profitable facility and one that is discarding nearly half its potential crop value.
| Standard or metric | Target value | Source basis |
|---|---|---|
| PPFD variance from mean | ±10–15% | US commercial horticulture consensus |
| Coefficient of variation (CV) | Below 15% | Industry production standard |
| Uniformity ratio (Emin/Eavg) | 0.75–0.90 | Multi-tier vertical farm guidelines |
| LED lumen depreciation rate | 3–5% annually | Vertical farm best practices |
| Preferred indirect lighting proportion | 35–65% of total | Interior spatial light distribution research |
Yield utilization impact of uniformity: When a hard product acceptance threshold is applied at 80% of target PPFD, crop yield utilization can drop from 99% to 46% between a well-designed and a poorly designed lighting installation.
Continuous re-validation is now a recognized best practice, not a one-time commissioning step. LED lumen depreciation and rack reconfigurations both shift the uniformity profile of an installation over time. Scheduling uniformity audits at regular intervals, aligned with your LED maintenance calendar, keeps CV and Emin/Eavg within target ranges across the full production lifecycle.
Ledgrowlightsdepot’s proximity-based LED systems address this directly. Their under-canopy light distribution technology is designed to maintain the tight PPFD distributions that commercial uniformity standards require, with documented yield improvements exceeding 20% over standard setups.
The Cambridge Core study on light heterogeneity in vertical farms measured PPFD and spectral quality across 256 positions in a working vertical farm and modeled the impact on microgreen biomass. The finding that stands out: light quality heterogeneity within the facility had a greater impact on uniform crop yields than intensity heterogeneity alone. Facilities tracking only PAR readings were missing the primary driver of yield variation.
Greenhouse research on diffused glazing materials tells a similar story from a different angle. When growers switched to diffused glass and light-scattering shade curtains, the primary benefit was not increased total light transmission. It was improved uniformity, both horizontally and vertically across the canopy. In some cases, that uniformity improvement alone increased fruit yield, even though total light input stayed roughly constant.
In multi-tier vertical farm layouts, the geometry of the structure itself creates predictable uniformity challenges. Fixtures mounted close to the canopy deliver high intensity but narrow coverage. Fixtures mounted higher deliver better spread but lower peak PPFD. The growers who resolve this tension most effectively use photometric simulation before installation, validate with full-grid mapping after, and treat uniformity as a living metric that needs periodic re-measurement rather than a one-time commissioning checkbox.
LED and high-pressure sodium (HPS) fixtures approach uniformity from fundamentally different starting points, and the gap between them has widened as LED technology has matured.
HPS fixtures emit light from a single point source, which produces a pronounced intensity peak directly beneath the lamp and a steep falloff toward the edges of the coverage area. Achieving acceptable uniformity with HPS requires careful spacing and often a larger number of fixtures than the intensity targets alone would suggest. The beam pattern is difficult to reshape without reflector modifications, and reflector degradation over time worsens the uniformity profile.
Linear bar-style LED fixtures distribute emitters across the full length of the bar, which produces a naturally wider and more even beam pattern from the start. Continuous runs of linear LED fixtures improve uniformity compared to grids of traditional HID fixtures, and they do so with fewer total fixtures when mounted at the right height. LEDs can also be mounted closer to the canopy in vertical farming applications, which opens up multi-tier configurations that HPS cannot practically support due to heat output.
The thermal profile matters for uniformity too. HPS fixtures generate substantial radiant heat, which creates temperature gradients across the canopy that compound the light intensity gradients. Plants directly under an HPS fixture experience both higher light and higher heat, accelerating transpiration and water demand relative to plants at the canopy edges. LED fixtures operating at lower radiant heat output reduce this compounding effect, making the uniformity of the light environment more representative of the actual growth environment the plant experiences.
For growers managing tight grow spaces, the lower heat output of LEDs also allows closer mounting without thermal stress, which gives more flexibility to dial in the beam overlap needed for a CV below 15%.
Lighting uniformity in commercial grows is as critical as light intensity, with poor distribution directly causing 10–30% yield losses and increased operational costs from sorting and grading non-uniform crops.
| Point | Details |
|---|---|
| CV below 15% is the target | Keep coefficient of variation under 15% and PPFD variance within ±10–15% of the mean. |
| Uniformity ratio guides layout decisions | An Emin/Eavg ratio below 0.75 signals a layout redesign is needed before yield losses accumulate. |
| Full-grid heatmaps outperform min-to-avg ratios | Full-grid PPFD mapping reveals distribution gaps that the traditional minimum-to-average metric misses. |
| Spectral uniformity matters as much as intensity | Uneven waveband distribution across the canopy drives biomass and quality differences independent of total PPFD. |
| Re-validate regularly | LED lumen depreciation of 3–5% annually means uniformity metrics drift without scheduled re-audits. |

Achieving a CV below 15% starts with fixtures engineered for even photon distribution, not just peak PPFD output. Ledgrowlightsdepot carries commercial-grade LED solutions designed specifically for tight uniformity across multi-tier and large-footprint grows. The Medic Grow GLC-1 lighting controller gives you precise cycle and intensity control to maintain consistent DLI across your entire facility. For high-output canopy coverage, the ROI-E720 LED grow light is built for even distribution at commercial scale. With over 5,800 verified reviews and a 4.8/5 satisfaction rating, Ledgrowlightsdepot backs every recommendation with real grower results.
0 of 3 items selected


Leave a comment