
Free Shipping in the USA on nearly all items!
Limited phone hours during the Holidays! Call us: 888-611-9305
Free Shipping in the USA on nearly ALL items! Limited phone hours during the Holidays!

LED coverage area means two things at once: the canopy footprint your fixtures need to reach, and the PPFD distribution they actually produce across that footprint at a stated mounting height. The one rule that matters is this: hit your target average PPFD and a minimum-to-average uniformity of roughly 0.75 or better, per ASABE S640. You confirm both with a PPFD map, not a spec sheet.
TL;DR:
- Achieving uniform PPFD distribution requires verifying a minimum-to-average ratio of 0.75 or higher on a detailed map, not just relying on specs.
- Mounting height significantly affects PPFD, with closer placement increasing efficiency and uniformity, especially when fixtures are designed for close-canopy mounting.
- Using a dense grid to measure PPFD at multiple points across the canopy origin is essential to detect low-PPFD zones that can reduce yield.
- Fixture optics and distribution geometry heavily influence canopy uniformity, with multi-emitter fixtures generally outperforming single high-output lights.
- Adjusting fixture spacing and height based on stage-specific crop needs and canopy shape helps meet target PPFD and DLI levels efficiently.
Marketing “coverage sqft” numbers skip the two variables that actually determine whether your canopy gets fed evenly: mounting height and measured uniformity. Run this checklist before you spend a dollar or drill a hanger.
A single center reading tells you almost nothing. Growers using a 9×9 grid have caught corner readings as low as 60 µmol/m²/s under a canopy where the center exceeded 1,100 µmol/m²/s, a gap no average would ever reveal.
Build your map with these steps:
Statistic Callout: ASABE S640 recommends a min:avg uniformity ratio of approximately 0.75 or higher for high-performance horticultural lighting. Below that, your low-PPFD zones are likely costing you yield even if your average number looks great on paper.
The most common mapping mistake is measuring to the floor instead of the canopy plane, which inflates every reading you take. A close second: trusting a manufacturer’s advertised coverage area with no stated height or PPFD data attached to it. If a spec sheet won’t tell you the height the map was taken at, the number is decorative.
Height is your coarse control. Spacing is how you fine-tune it. Move a fixture down or up by just 2 to 6 inches and you can shift canopy PPFD meaningfully, because light intensity follows inverse-square behavior: doubling the distance between fixture and canopy can cut PPFD by roughly 75% in point-source approximations, per the Frontiers in Plant Science research on close-canopy lighting.
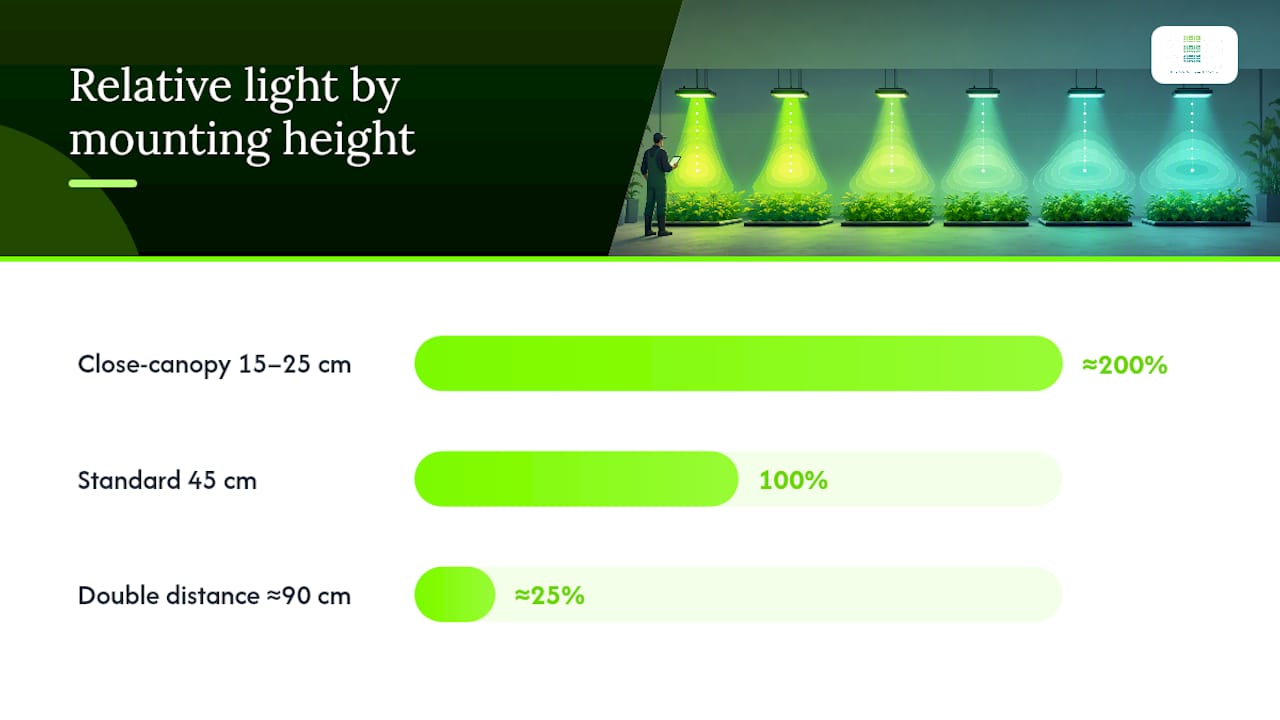
That same research found close-canopy mounting, in the 15 to 25 centimeter range, can roughly double energy-utilization efficiency compared to mounting at 45 centimeters. More photons land where the plant can use them, and you spend less power lighting the walkway. The trade-off: fixtures built for wide-throw mounting often lose uniformity badly when you bring them in close, so close-canopy only works with hardware designed for it.
Starting ranges by stage, always verified with a meter afterward:
Our stage-by-stage hanging guide breaks these down further by crop and fixture type.
Pro Tip: Read the PPFD at the midpoint between two adjacent fixtures. If that number sags below your target, move the fixtures closer together or raise them slightly to blend the beams. If the midpoint spikes into a hot band, spread them apart or dim the output instead.
A single high-output point source throws harsh shadows deep into the canopy. Large-area emission fixtures and multi-bar arrays spread that same photon output across more emission points, which reduces shadowing and raises PPFD in the low spots a single-point light would starve, according to a Frontiers summary on canopy-depth light distribution.
Before you buy anything, pull up the manufacturer’s PPFD map or IES file at the height you actually plan to run the fixture. A wattage number and an efficacy figure tell you what the fixture consumes, not where the photons land. Two fixtures rated at identical PPF can produce wildly different canopy uniformity depending on lens design and LED pitch.
Our comparison of bar fixtures versus panel lights covers how form factor changes shadow patterns across a real canopy.
A defensible layout follows a fixed sequence, not a guess based on a room’s dimensions. This is the same structure TruLeaf’s layout methodology recommends for commercial rooms.
If you can’t hit both numbers at a power draw that makes sense, the fix usually isn’t more wattage. It’s different fixture geometry or a smaller effective footprint.
| Step | What you check | Target |
|---|---|---|
| Estimate | PPF and PPFD map at candidate height | Matches crop PPFD/DLI goal |
| Install | Mounting height, initial spacing | Within stage-based range |
| Measure | Min, max, average, min:avg | Uniformity ≥ 0.75 |
| Revise | Height, spacing, dimming, perimeter fill | Both average and uniformity met |
Some companies build their product recommendations around this same measurement discipline, because customers who verify coverage instead of trusting a coverage label tend to see better results.
Before you buy a fixture, compare these specs side by side on the product page:
Read the PPFD-per-watt efficiency guide next if you’re comparing running costs across fixture options, and check the lighting uniformity guide for commercial grows if you’re scaling past a single tent. Commercial operators planning multi-room installs can request layout help directly rather than guessing at fixture counts.
A square tent with a round canopy wastes light in the corners no matter how good your fixture is. Coverage area planning has to follow the actual shape of your plant mass, not the shape of the room, because PPFD maps built for a rectangular footprint will overstate coverage on a canopy that never fills the corners.
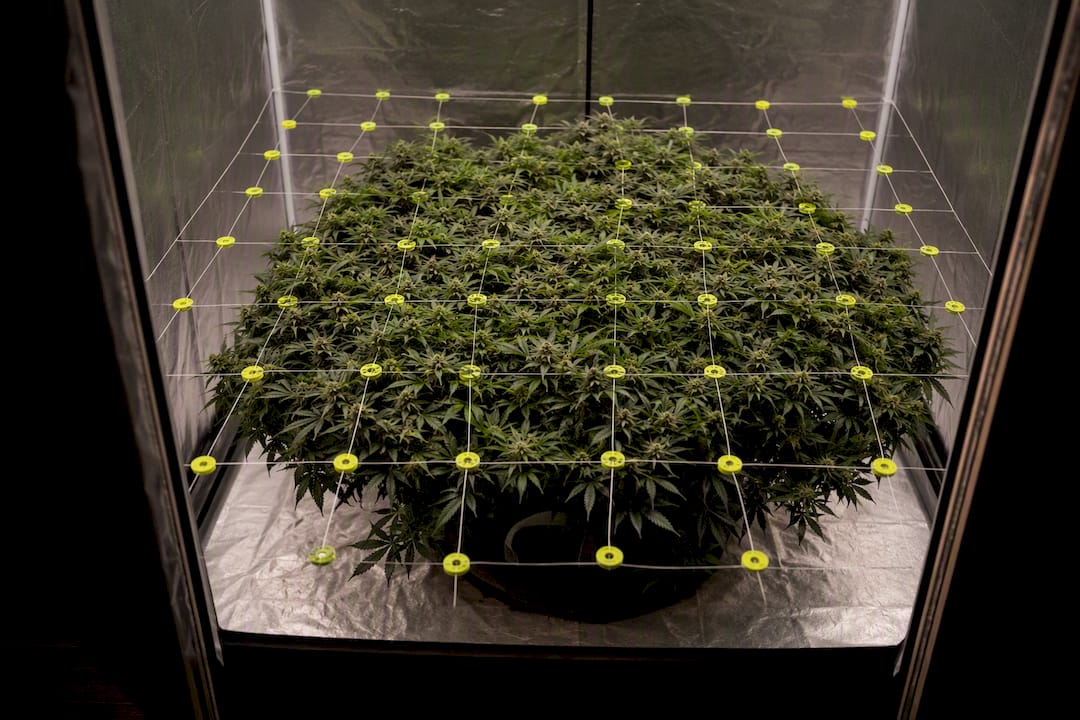
Species matters just as much as shape. A dense, short canopy like lettuce or basil wants even, moderate PPFD across a flat plane, since there’s little vertical structure to penetrate. A tall, branchy crop like tomatoes or cannabis in flower develops a canopy with real depth, meaning light has to punch through upper leaves to reach lower bud sites or fruiting trusses. That’s a different coverage problem entirely: you’re not just filling a footprint, you’re managing penetration through multiple leaf layers.
Vertical racking compounds this. Each shelf effectively resets your coverage area calculation, since shelf height, canopy density, and crop stage can all differ level to level. A rack running clones on the bottom shelf and flowering plants on the top shelf needs two separate PPFD maps, two separate height decisions, and likely two different fixture types entirely.
The practical fix is to measure your actual canopy shape before you finalize fixture count, using a grid that matches the canopy’s real footprint rather than the tent’s four walls. If your canopy is round or irregular, weight your grid points toward where plant mass actually sits, and accept that corner PPFD in an unfilled space matters less than corner PPFD under actual leaf tissue.
Daily Light Integral, the total photon count a canopy receives over a full photoperiod, changes what “adequate coverage” even means for your crop. A PPFD map that looks perfect at a single point in time says nothing about whether your canopy hits its daily target once you factor in photoperiod length.
Two grows running identical PPFD maps can need completely different fixture counts if one runs an 18-hour vegetative photoperiod and the other runs a 12-hour flowering photoperiod. Lower PPFD sustained over more hours can hit the same DLI as higher PPFD over fewer hours, which means your coverage area target isn’t fixed. It shifts with your photoperiod schedule.
This is why coverage planning has to start with a DLI target, not just a PPFD number pulled from a stage chart. Once you know the DLI your crop needs at a given stage, you can back-calculate the PPFD your map needs to average across the photoperiod you’re running, then check that number against your measured min:avg uniformity to confirm the whole canopy, not just the center, is actually getting there.
Our DLI guide for indoor grows walks through the conversion math for high-light crops like cannabis, and our stage-by-stage PPFD guide pairs specific PPFD ranges with the DLI outcomes they typically produce across a full photoperiod.
Coverage area isn’t only about intensity. The spectral makeup of the light reaching each point on your PPFD map determines how effectively the plant actually uses those photons, which means two zones with identical PPFD readings can produce different growth outcomes if the spectrum reaching them differs.
This happens more often than growers expect. Multi-bar arrays and fixtures with mixed diode types can shift spectral ratios slightly across the emission field, especially near the edges where light from adjacent bars overlaps at different angles than light directly beneath a bar. A canopy edge might read an acceptable PPFD number while receiving a subtly different red-to-blue or red-to-far-red ratio than the center.
For vegetative growth, a spectrum weighted toward blue tends to support compact, dense structure, while flowering and fruiting stages generally respond better to a red-heavy spectrum with some far-red presence to support stretch and bud development. If your coverage map shows uniform PPFD but you’re seeing inconsistent structure or bud development across the canopy, spectral variation across the fixture’s emission field is worth checking, not just intensity.
Fixtures with adjustable spectrum channels give you a second layer of control beyond height and spacing. You can hold your PPFD map steady while shifting the ratio to match the crop stage, without moving a single fixture. That flexibility matters most in rooms running multiple stages simultaneously, where a single fixed spectrum has to compromise across every plant in the room.
The same three mistakes show up in almost every layout review. First, growers light the floor instead of the canopy, taking readings before plants have grown into the space the map was supposed to represent. Second, they trust a single center reading and assume it represents the whole footprint, missing the corner and edge deficits a full grid would catch. Third, they map once at install and never again, missing the uniformity shift that comes with canopy stretch.
My advice: map at the closest expected canopy height before you finalize anything, then map again after significant growth. Every install deserves a quick checklist: minimum, average, and min:avg uniformity, recorded and compared against your target every time.
— Scott
Most fixture pages online give you a wattage number and a vague coverage claim. That’s not enough to plan a layout that actually hits your uniformity target, which is why comparing real PPFD maps at your intended mounting height matters more than comparing marketing specs.
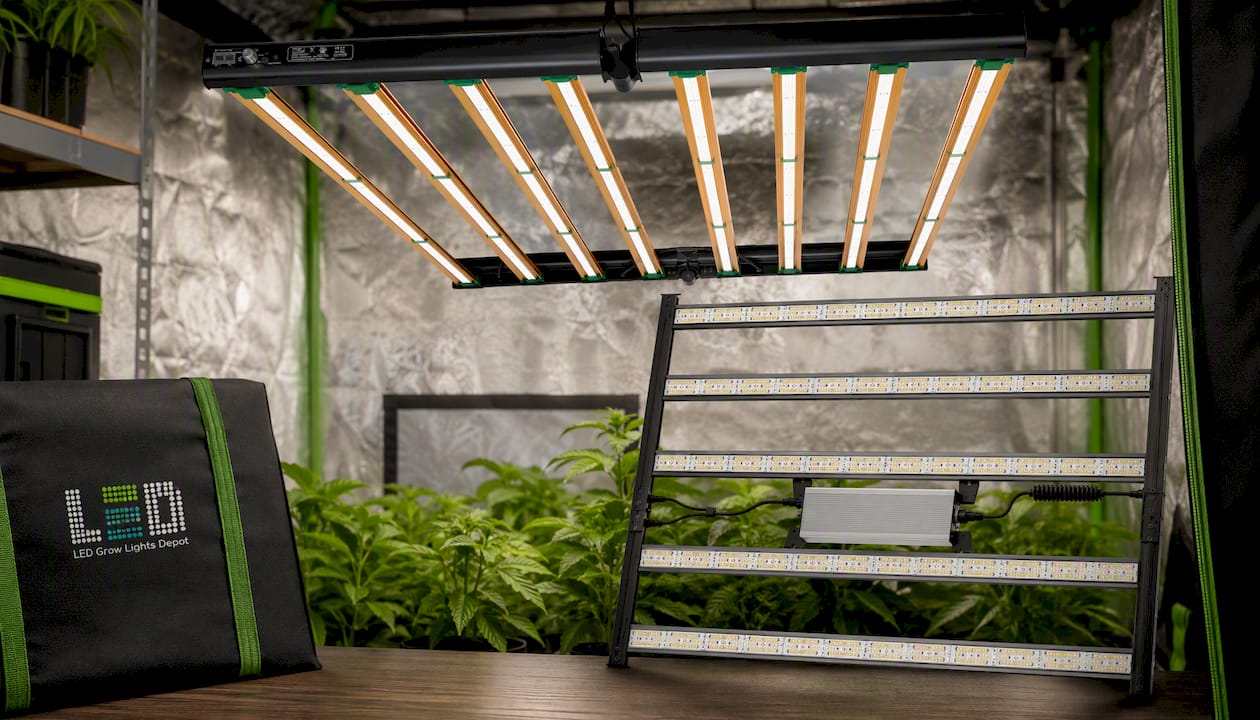
The Grower’s Choice ROI-E720 product page lists PPFD data at named heights so you can check it against your own canopy footprint before you buy. If you’re running a larger room and need the shadow-reducing benefits of a multi-bar layout, the HortiBloom Mega Optic 720W is built with lensing and IR channels specifically for large-area emission at close mounting distances.
Your next practical move is simple: get a quantum sensor if you don’t already have one, follow our grow room light mapping guide to build your first grid, and compare the results against your target uniformity. Running a commercial install with multiple rooms or racks? Reach out through LedGrowLightsDepot for layout help, or start browsing the full fixture lineup at Ledgrowlightsdepot to find specs matched to your mounting height.
0 of 3 items selected


Leave a comment