
Free Shipping in the USA on nearly all items!
Limited phone hours during the Holidays! Call us: 888-611-9305
Free Shipping in the USA on nearly ALL items! Limited phone hours during the Holidays!

Light quality and quantity set a plant’s nutrient demand. Change the light, and you change which nutrients the plant can absorb, how fast it moves them, and where they go inside the tissue. That’s the core of indoor grow nutrient light interaction, and it’s why two identical feeding programs can produce wildly different results under different fixtures.
The practical levers are three: spectrum (which wavelengths hit the canopy), intensity (PPFD in µmol·m⁻²·s⁻¹ and cumulative DLI in mol·m⁻²·d⁻¹), and photoperiod (hours of light per day). University of Maryland Extension confirms that light quality, duration, and intensity each independently affect plant development indoors. Ledgrowlightsdepot’s proximity lighting systems are built exactly around this principle, using under-canopy supplemental bars to close the gap between what the top canopy receives and what the lower leaves actually need.
Key implications at a glance:
Photosynthesis rate is the master dial. When light intensity rises, the chloroplasts produce more ATP and NADPH, which accelerates carbohydrate synthesis. That carbohydrate surplus is what fuels active ion pumps in root cells, so higher light directly increases the plant’s capacity to pull nitrogen, phosphorus, potassium, calcium, and magnesium from the root zone. Cut the light, and those pumps slow down regardless of how much fertilizer is in the solution.
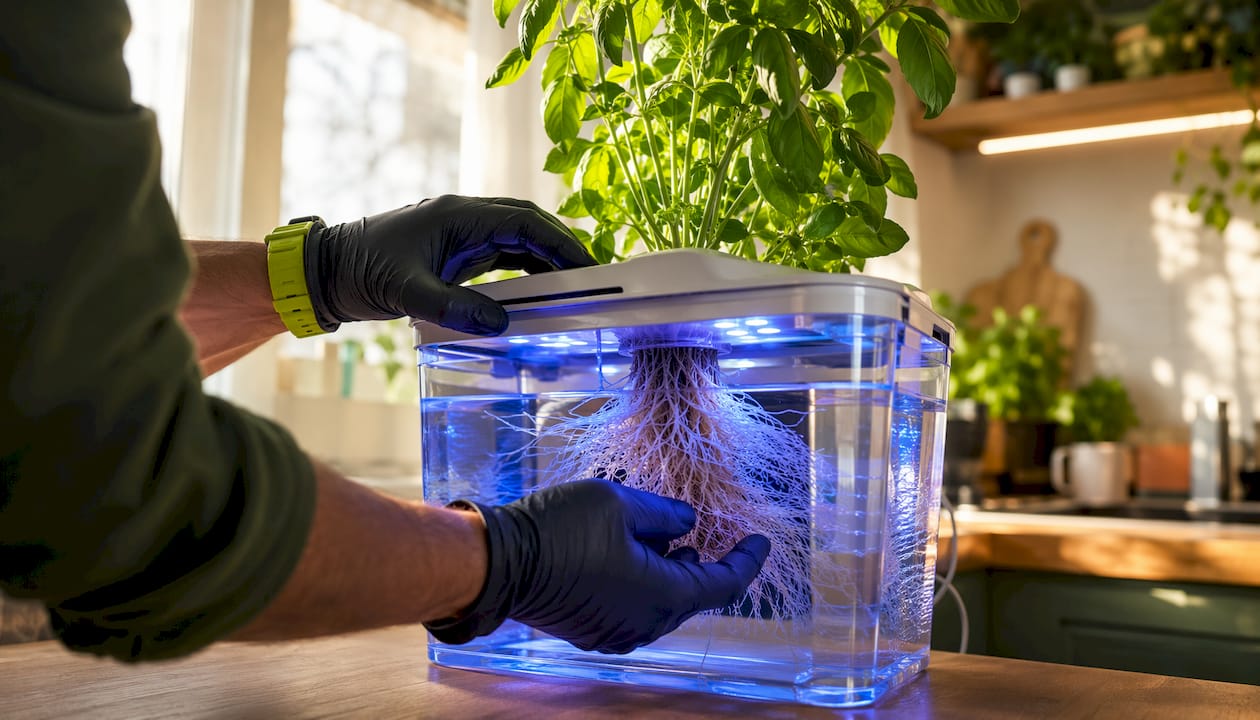
Stomatal conductance ties light to mass flow. Stomata open in response to blue light, and as they open, transpiration increases. That transpiration stream is the main delivery vehicle for mobile nutrients like calcium and nitrogen, which travel from root to shoot dissolved in water. Under low light, stomata stay partially closed, transpiration drops, and calcium in particular struggles to reach developing tissues fast enough, which is why tip burn is so common in low-light indoor setups.
Photoreceptors add a second layer. Phytochromes respond to red and far-red ratios, while cryptochromes respond to blue light. Both classes alter gene expression for specific transporter proteins, including nitrate transporters and calcium channel proteins. Light is not just an energy source here; it is a molecular signal that tells the plant which nutrients to prioritize. A 2025 study on light–nitrogen interactions makes this explicit: light and nitrogen function as interdependent inputs, and excess nitrogen under insufficient light creates metabolic bottlenecks that produce rapid but structurally weak, leggy growth.
| Mechanism | Light trigger | Nutrient consequence |
|---|---|---|
| ATP/NADPH production | All PAR wavelengths | Increases active ion uptake capacity |
| Stomatal opening | Blue light (cryptochrome) | Raises transpiration and Ca/N mass flow |
| Nitrate transporter expression | Blue + red signals | Upregulates N uptake at root membrane |
| Phytochrome signaling | Red/far-red ratio | Shifts allocation between vegetative and reproductive sinks |
| Carbohydrate loading (phloem) | High overall PAR | Drives P/K demand in reproductive tissues |
Pro Tip: If your plants look lush and green but stems are soft and internodes are long, suspect a light–nitrogen mismatch before adding more fertilizer. The problem is almost always too little light for the nitrogen already in the system.
Spectrum is not just about color. Each spectral band triggers distinct physiological responses, and those responses carry direct consequences for which nutrients the plant demands and when.
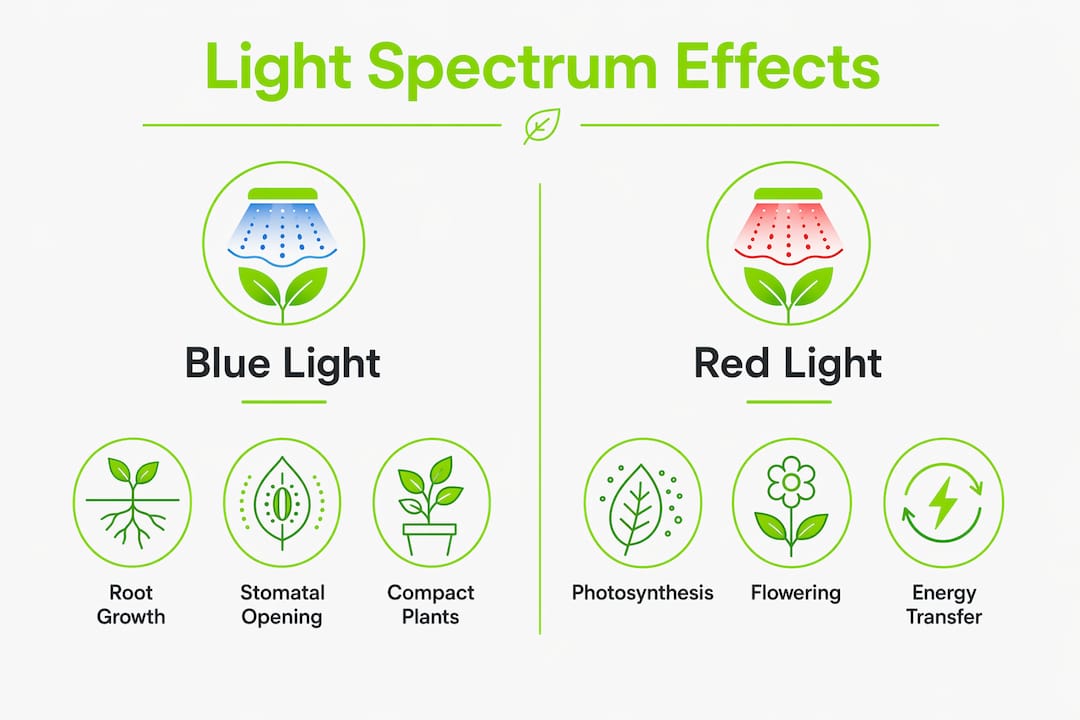
Blue wavelengths promote compact vegetative growth, stimulate root branching, and drive stomatal opening. University of Maryland Extension links blue light specifically to improved root signaling and enhanced uptake of calcium and magnesium in indoor settings. More root surface area means more absorption sites; better stomatal conductance means faster calcium delivery through the transpiration stream. During vegetative stages, a blue-dominant spectrum is the right call for building the root architecture that will support nutrient uptake through the entire crop cycle.
Red drives photosynthesis efficiently and triggers phytochrome-mediated flowering responses. As plants shift into reproductive mode under red-dominant light, sink strength in flowers and fruits increases sharply. Carbohydrates and phosphorus flow toward those sinks, and potassium demand rises to support sugar loading and cell expansion. Growers running high-red spectra during bloom need to raise P/K in the feed while monitoring that nitrogen doesn’t accumulate unused in vegetative tissue.
Green is the most underestimated band in indoor growing. It penetrates deeper into the canopy than red or blue, reaching leaves that would otherwise be in photosynthetic shadow. Research published in Frontiers in Plant Science shows that green light improves nitrogen assimilation in lower-canopy leaves by increasing chlorophyll efficiency and electron transport rates, particularly under limited nitrogen supply. A spectrum with 20–25% green fraction can meaningfully improve whole-plant nitrogen use efficiency in dense canopies.
Far-red wavelengths (700–800 nm) shift the phytochrome equilibrium toward the Pfr form, which accelerates flowering in many species and changes nutrient partitioning between vegetative and reproductive tissues. Adding far-red during the last hours of a photoperiod can effectively extend the light period’s physiological impact. For more on how infrared and far-red affect canopy behavior, this technical breakdown is worth reading.
Low-dose UV acts as a stress signal that upregulates secondary metabolite pathways, including flavonoids and terpenes. These pathways compete for carbon and certain micronutrients like manganese and iron, so UV-supplemented grows may show slightly elevated micronutrient demand. The effect is dose-dependent; excessive UV causes oxidative damage rather than productive stress.
Actionable spectrum tuning rules:
| Wavelength band | Primary plant response | Nutrient implication |
|---|---|---|
| Blue (400–500 nm) | Root development, stomatal opening | Increased Ca and Mg uptake |
| Green (500–600 nm) | Lower-canopy photosynthesis, N enzyme activity | Improved N assimilation in shaded tissue |
| Red (600–700 nm) | Flowering, reproductive sink strength | Raised P and K demand |
| Far-red (700–800 nm) | Phytochrome shift, allocation change | Shifts nutrients toward reproductive tissue |
| UV (280–400 nm) | Secondary metabolite induction | Elevated micronutrient demand (Mn, Fe) |
PPFD (Photosynthetic Photon Flux Density) measures instantaneous light intensity at the canopy in µmol·m⁻²·s⁻¹. DLI (Daily Light Integral) is the cumulative total over a full photoperiod, measured in mol·m⁻²·d⁻¹. DLI is the number that actually predicts daily carbohydrate production and, by extension, daily nutrient demand.
The conversion is straightforward: DLI = PPFD × (photoperiod in hours × 3600) ÷ 1,000,000. At 400 µmol·m⁻²·s⁻¹ for 18 hours, DLI = 400 × 64,800 ÷ 1,000,000 = 25.9 mol·m⁻²·d⁻¹. At the same PPFD for 12 hours, DLI drops to 17.3. The plant under the 18-hour schedule is doing roughly 50% more photosynthetic work per day, and its nutrient demand reflects that. UMN Extension confirms that higher light intensity and longer photoperiods increase both water use and nutrient throughput, requiring growers to raise feed frequency or concentration as DLI rises.
For photoperiod limits, University of Maryland Extension recommends capping most indoor crops at around 16 hours of artificial light per day to preserve proper dark-period physiology.
| PPFD (µmol·m⁻²·s⁻¹) | Photoperiod (hrs) | DLI (mol·m⁻²·d⁻¹) | Demand tier | Nutrient adjustment |
|---|---|---|---|---|
| 150 | 16 | — | Low | 1/4 label strength; water less frequently |
| — | 16 | — | Moderate | 1/4–1/2 strength; monitor EC weekly |
| 400 | 16 | — | High | 1/2 strength or higher; increase feed frequency |
| 400 | 18 | 25.9 | High | Raise ppm; watch Ca/Mg as transpiration climbs |
| 600 | 18 | — | Very high | Full or near-full program; flush every 2–3 weeks |
Numbered steps to calculate your DLI and set feed strength:
For small setups, this sizing guide covers how to estimate PPFD from fixture wattage before you own a meter.
The fixture you choose determines spectrum, heat output, and canopy penetration, and each of those factors changes how you feed.
LED fixtures offer tunable spectra and low radiant heat. Because LEDs don’t heat the canopy the way HPS does, transpiration rates are lower at equivalent PPFD, which means calcium delivery through mass flow is slower. Growers switching from HPS to LED often see calcium or magnesium deficiency in the first cycle, not because the nutrient isn’t in the solution, but because the transpiration-driven delivery mechanism has changed. Under-canopy and proximity LED bars address this by increasing light distribution to lower leaves, raising whole-plant photosynthesis and transpiration without adding heat stress. The benefits of LED grow lights include this spectrum tunability as a core advantage for managing grow light nutrient balance across stages.
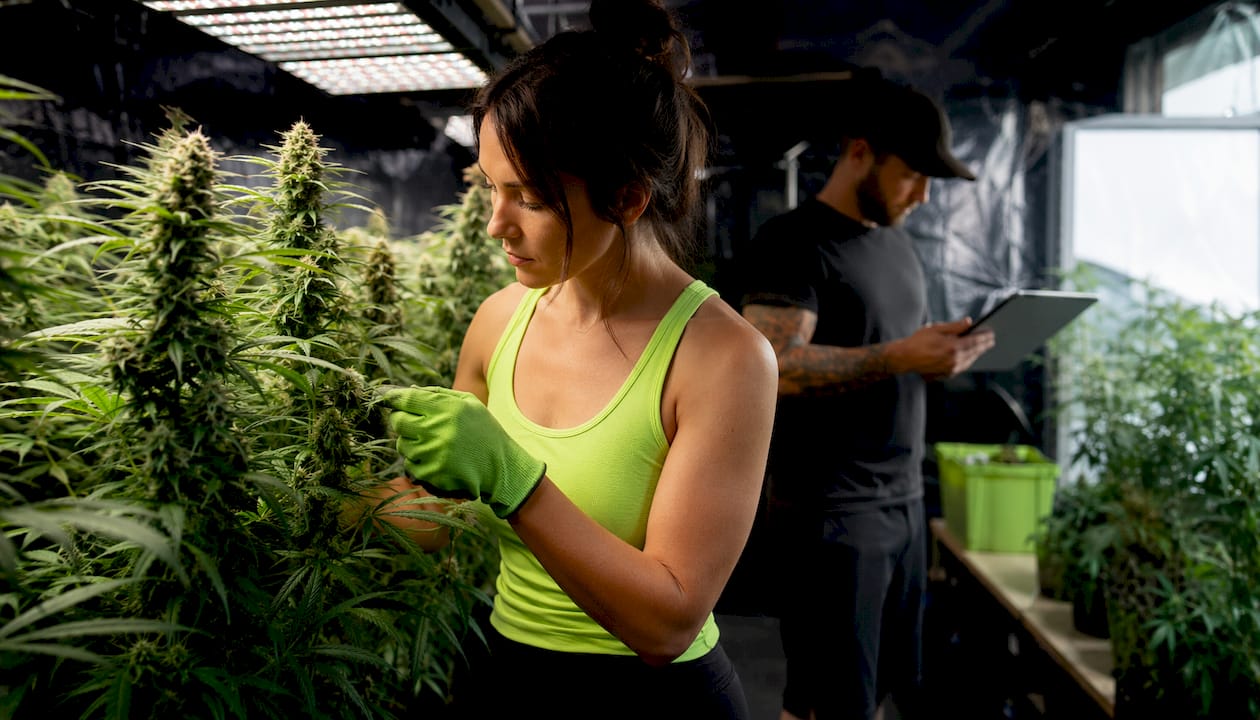
HPS fixtures produce a broad, red-rich spectrum with significant radiant heat. That heat raises canopy temperature and accelerates transpiration, which increases calcium uptake through mass flow but also concentrates salts in the root zone faster. EC in the substrate can climb quickly under HPS, especially in containers with limited drainage. Growers need to flush more frequently and monitor EC runoff closely. The heat also raises VPD, which can push plants into mild stress if humidity isn’t managed, further complicating nutrient uptake.
Fluorescent and compact fluorescent fixtures deliver low PPFD, typically under 150 µmol·m⁻²·s⁻¹ at canopy. Growth is slow, nutrient demand is low, and overfeeding is the most common mistake. These setups almost always call for quarter-strength feeding at most.
Fixture-specific nutrient management tips:
| Fixture type | Heat output | Canopy penetration | Key nutrient risk | Management priority |
|---|---|---|---|---|
| LED (full-spectrum) | Low | Moderate (improves with proximity bars) | Ca/Mg deficiency after HPS switch | Proactive Cal-Mag supplementation |
| HPS | High | Good | Salt accumulation, EC spike | Frequent flushing, EC monitoring |
| Fluorescent/CFL | Very low | Poor | Overfeeding, salt buildup | Quarter-strength feeding only |
Stage-specific feeding tied to your light regime is where most indoor growers leave yield on the table. The spectrum and DLI you’re running should directly inform your NPK ratios, EC targets, and supplementation schedule.
Nitrogen drives vegetative growth, but the amount the plant can use is capped by photosynthesis rate. Under high blue light and a DLI above 20 mol·m⁻²·d⁻¹, nitrogen demand is real and sustained. Keep EC moderate rather than pushing it high; the plant’s uptake capacity is the limiting factor, not the supply. Calcium and magnesium are critical here because root development is rapid and transpiration is active. University of Maryland Extension flags magnesium as particularly prone to leaching in container systems and recommends periodic supplementation, such as an Epsom salts solution, when monitoring shows deficiency.
As you introduce more red light and reduce blue, reproductive sinks begin to form. Nitrogen demand drops relative to phosphorus and potassium. Shift the NPK ratio gradually, not abruptly. Watch EC closely during this phase because expanding reproductive sinks can temporarily increase osmotic demand, and a sudden EC spike stresses the plant at exactly the wrong moment.
Phosphorus supports energy transfer for flower and fruit development; potassium drives sugar loading and cell expansion. Both should be elevated during peak bloom. Micronutrients involved in reproductive tissue development, including boron and zinc, become more important. Foliar feeds work well here for fast correction because root uptake can lag behind demand during peak flowering. For a broader look at how LED spectra affect yield at this stage, this resource on maximizing indoor yield covers the lighting side in detail.
| Stage | Light emphasis | N | P | K | Ca/Mg | EC direction |
|---|---|---|---|---|---|---|
| Vegetative | High blue, DLI 20+ | High | Moderate | Moderate | High | Moderate, stable |
| Transition | Shifting to red | Decreasing | Increasing | Increasing | Maintain | Watch for spike |
| Bloom/fruiting | High red, DLI 25+ | Low | High | High | Maintain | Increase gradually |
| Late bloom/flush | Reduce intensity | Minimal | Minimal | Minimal | Low | Drop to near zero |
Dos and don’ts:
Pro Tip: During transition, run your EC meter on the runoff, not just the input. If runoff EC is climbing more than 0.5 dS·m⁻¹ above input, back off feed strength before the plant shows stress symptoms.
The instruments that matter most are a quantum PAR meter (for PPFD), an EC/ppm meter, a pH meter, and a thermo-hygrometer for VPD. Together they give you a complete picture of why a plant is or isn’t absorbing nutrients.
Essential instruments and what they tell you:
| Visual symptom | Likely cause | Immediate fix |
|---|---|---|
| Interveinal chlorosis (older leaves) | Magnesium deficiency | Foliar spray with Epsom salts (1 tsp/gal); check light spectrum |
| Tip burn on young leaves | Calcium deficiency, low transpiration | Raise airflow/VPD; add Cal-Mag to feed; check blue light fraction |
| Yellowing lower leaves | Nitrogen deficiency or salt lockout | Check EC and pH; flush if EC is high; raise N if EC is normal |
| Soft, leggy stems | Excess N under low light | Reduce feed strength; increase PPFD before raising N |
| Brown leaf edges | Over-fertilization or salt burn | Flush thoroughly; reduce feed concentration |
| Purple stems/leaves | Phosphorus deficiency or cold roots | Raise root zone temperature; increase P in feed |
Timeline expectations: after adjusting light or feed, expect foliage color changes within 5–10 days for mobile nutrients like nitrogen and magnesium. Calcium-related symptoms, which affect new growth, take 2–3 weeks to resolve because the plant must produce new tissue. Root-driven corrections after a major light change can take a full 2–3 weeks to stabilize.
The troubleshooting sequence that works: measure PPFD and calculate DLI first, then check EC and pH in the root zone, then assess VPD, then look at visual symptoms. Jumping straight to symptoms without the measurements leads to misdiagnosis.
The most common nutrient bottleneck in dense indoor canopies isn’t a missing element. It’s a light distribution problem. When lower leaves are in photosynthetic shadow, they contribute little to whole-plant carbohydrate production. The root system, which depends on that carbohydrate supply to power active ion uptake, operates below capacity. Nutrients accumulate in the root zone not because the plant doesn’t need them, but because it lacks the energy to pull them in.
Proximity and interlighting LEDs solve this by delivering photons directly to mid- and lower-canopy leaves. When those leaves resume active photosynthesis, whole-plant carbohydrate supply increases, root ion pumps run harder, and nutrient uptake efficiency improves across the board. Green light’s role in canopy photosynthesis is particularly relevant here, since green wavelengths penetrate deeper into dense foliage than red or blue. Research in Frontiers in Plant Science confirms that green light increases nitrogen assimilation enzyme activity in shaded tissue, which directly supports this mechanism.
Ledgrowlightsdepot’s proximity lighting systems are designed around this principle. Growers using these systems have reported improved bud grading and yield increases, with the nutrient program adjusted to match the higher whole-plant uptake capacity. The practical adjustment: when adding proximity bars, reduce base fertilizer strength by roughly 10–15% initially and let EC runoff guide you back up. The plant’s uptake will increase, and you want to feed that demand rather than flood ahead of it.
Under-canopy lighting doesn’t just add photons — it reactivates the root’s nutrient pump by restoring carbohydrate supply to the whole plant. The nutrient program should follow the light change, not precede it.
Pro Tip: Start with 1–2 proximity bars per square meter positioned at mid-canopy height. Measure PPFD at the lower leaves before and after installation. If lower-leaf PPFD increases by 50 µmol·m⁻²·s⁻¹ or more, expect a meaningful uptake response within 10–14 days and adjust EC accordingly.
Measure PPFD and calculate DLI. Use a quantum meter at canopy height. Record the number, multiply by photoperiod hours and 3,600, then divide by 1,000,000. Write down your baseline EC, pH, and VPD at the same time.
Match spectrum to stage. Blue-dominant for vegetative growth; shift toward red as flowering begins. If your fixture is not tunable, plan your nutrient adjustments around the fixed spectrum it delivers.
Set feed strength to match DLI. Low DLI (under 12 mol·m⁻²·d⁻¹): start at 1/4 label strength. Moderate DLI (12–22): use 1/4–1/2 strength. High DLI (above 22): work up toward 1/2 strength or higher based on EC runoff. Always pre-wet the medium before feeding.
Monitor weekly. Check EC in the runoff or reservoir. If EC is drifting upward by more than 0.5 dS·m⁻¹ above input, flush before the next feed. Use foliar sprays for fast micronutrient correction (Mg, Fe) while root-zone adjustments take effect.
Adjust for stage transitions. When shifting from veg to bloom, reduce nitrogen and increase P/K over 5–7 days. Don’t change light and nutrients simultaneously in one day; stagger the changes so you can isolate the cause if something goes wrong.
| Week | Action | Measurement |
|---|---|---|
| Week 1 | Measure PPFD, set baseline EC/pH/VPD | Record all three; calculate DLI |
| Week 2 | Confirm feed strength matches DLI tier | Check runoff EC; adjust if drifting |
| Week 3–4 | Stage transition: shift spectrum and NPK ratio | Monitor visual symptoms daily |
| Every 2–3 weeks | Flush if EC is accumulating | Runoff EC should return near input EC |
| Ongoing | Foliar feed for fast micronutrient fixes | Apply in early light cycle, not peak intensity |
Light spectrum, intensity, and photoperiod are the primary drivers of nutrient demand in indoor grows, and every feeding decision should be calibrated to the DLI your fixtures actually deliver.
| Point | Details |
|---|---|
| DLI sets feed strength | Low DLI (under 12) calls for 1/4 label strength; high DLI (above 22) supports 1/2 strength or more. |
| Blue light supports Ca/Mg uptake | Blue wavelengths drive stomatal opening and root development, improving calcium and magnesium absorption. |
| Green light aids N assimilation | Green wavelengths reach shaded lower leaves and increase nitrogen assimilation enzyme activity in dense canopies. |
| Pre-wet before every feed | Feeding dry media causes fertilizer burn; always moisten the substrate before applying nutrients. |
| Ledgrowlightsdepot proximity systems | Under-canopy LED bars restore lower-leaf photosynthesis and improve whole-plant nutrient uptake, supporting higher yields. |
Most growers treat light and nutrients as separate dials. They dial in their feeding program from a chart, then dial in their light from a fixture spec sheet, and wonder why the two don’t produce the results they expected. The real relationship runs in one direction: light sets the ceiling, and nutrients fill up to it.
The practical consequence is that overfeeding under low light is far more common than underfeeding under high light. When a plant can’t photosynthesize fast enough to use the nitrogen in the root zone, that nitrogen doesn’t disappear. It accumulates, raises EC, and eventually locks out calcium and potassium through ion competition. The plant looks overfed, but the actual problem is underlighting.
The fix is almost always to raise PPFD before raising feed concentration. Get the light right first, measure the DLI, then let the plant’s uptake response tell you how much to feed. Runoff EC is a more honest signal than any feeding chart. If EC is stable or dropping, the plant is eating. If it’s climbing, back off the feed or improve the light before adding more.
One more thing growers underestimate: the transition from HPS to LED. The spectrum shift changes transpiration rates, which changes calcium delivery. Growers who switch fixtures without adjusting their Cal-Mag program almost always see tip burn within two weeks. It’s not the LED’s fault; it’s a failure to account for the changed physiology.
Getting the light–nutrient relationship right starts with fixtures that give you real control over spectrum and intensity. Ledgrowlightsdepot carries a full range of LED grow lights, proximity bars, and lighting controllers built specifically for growers who want to tune their light program to their feeding program, not guess at it.
The TrolMaster Hydro-X DLI Lighting Control Adapter lets you automate DLI targets directly, so your photoperiod adjusts to hit the cumulative light dose your nutrient program is built around. For higher-output rooms, the California Lightworks SolarSystem 1100 delivers the PPFD needed to justify a full nutrient program without guessing at intensity. Pair either with proximity bars under the canopy and you close the light distribution gap that causes most nutrient bottlenecks.
Ledgrowlightsdepot holds a 4.8 out of 5 rating from more than 5,800 customer reviews, and the team provides expert guidance on matching fixtures to grow space and crop stage. Browse the full LED grow light selection to find the right fixture for your setup, or contact the team directly for a recommendation tailored to your canopy size and DLI targets.
0 of 3 items selected


Leave a comment