
Free Shipping in the USA on nearly all items!
Limited phone hours during the Holidays! Call us: 888-611-9305
Free Shipping in the USA on nearly ALL items! Limited phone hours during the Holidays!

The formula is DLI (mol/m²/day) = PPFD (µmol/m²/s) × photoperiod (hours) × 3,600 ÷ 1,000,000. Run a 400 µmol/m²/s fixture for 16 hours and you get 23.04 mol/m²/day: 400 × 16 × 3,600 ÷ 1,000,000. PPFD measures light intensity at an instant; DLI adds up that intensity across an entire photoperiod, which is why it predicts plant growth far better than a single meter reading ever could.
TL;DR:
- The quick DLI calculation works accurately only with stable light sources like fixed LED or HPS fixtures, not with sunlight or variable schedules.
- Measuring DLI precisely requires frequent logging of PPFD at canopy level using calibrated sensors and summing the data over the photoperiod.
- Converting older light data like foot-candles or lux into DLI involves approximate multipliers that vary based on light source and spectral output, making them less reliable.
- The intended DLI target depends on crop type and growth stage, with high-light plants like cannabis during flowering requiring 15 to 30+ mol/m²/day.
- Common calculation errors include using rated fixture PPFD instead of measured canopy PPFD and neglecting transmission losses from structural shading or glazing.
That 3,600 in the formula converts hours into seconds, since PPFD is measured per second. The 1,000,000 converts micromoles into moles, because DLI is expressed in mol/m²/day while your quantum meter reads in µmol/m²/s. Multiply those two conversions together and you get the shorthand many growers use instead: DLI = PPFD × hours × 0.0036.
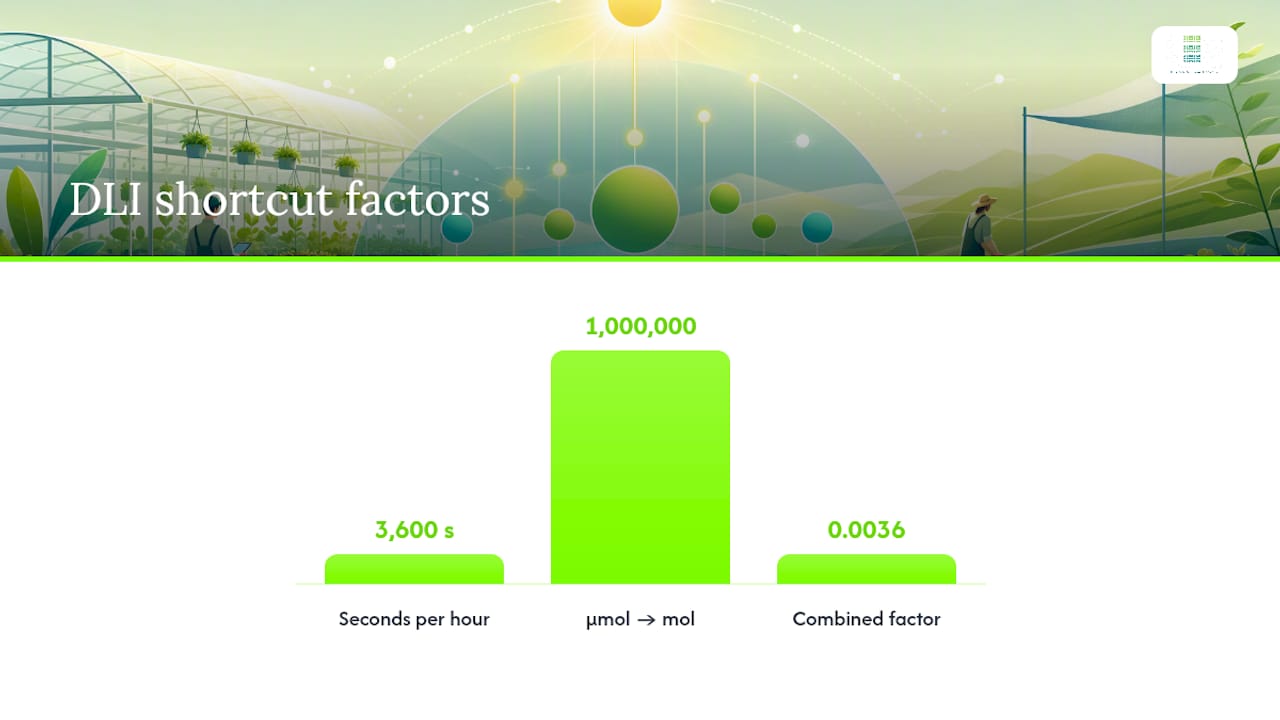
This shortcut only holds up when your light source is stable. LED and HPS fixtures on a fixed timer qualify, since their output doesn’t drift meaningfully once they’re warmed up. Sunlight does not qualify, nor does a dimmed schedule that ramps intensity up and down, because the formula assumes the same PPFD value applies for every second of the photoperiod.
Here’s the math in three steps for a 4×4 tent running an 18-hour vegetative schedule at 600 µmol/m²/s:
Before you calculate anything, gather three numbers: measured PPFD at canopy height (not the manufacturer’s spec sheet value), your exact photoperiod in hours, and confirmation that the fixture holds steady output across that whole period.
Sunlight changes by the minute, so a single PPFD reading tells you almost nothing about the day’s total. The fix is a quantum sensor paired with a data logger that samples frequently and sums the results. Purdue Extension recommends logging every 15 to 60 seconds for research-grade accuracy, though minute-level logging is acceptable for most greenhouse monitoring. Wider gaps between readings miss cloud passes and shading events that can swing PPFD by hundreds of units in seconds.
The math behind this is the discrete-sum method: treat each logged reading as a rectangle, intensity times the interval it represents, then add every rectangle together. LI-COR’s technical guidance frames it exactly this way, and it’s the same principle whether you’re summing 96 readings or 5,760.
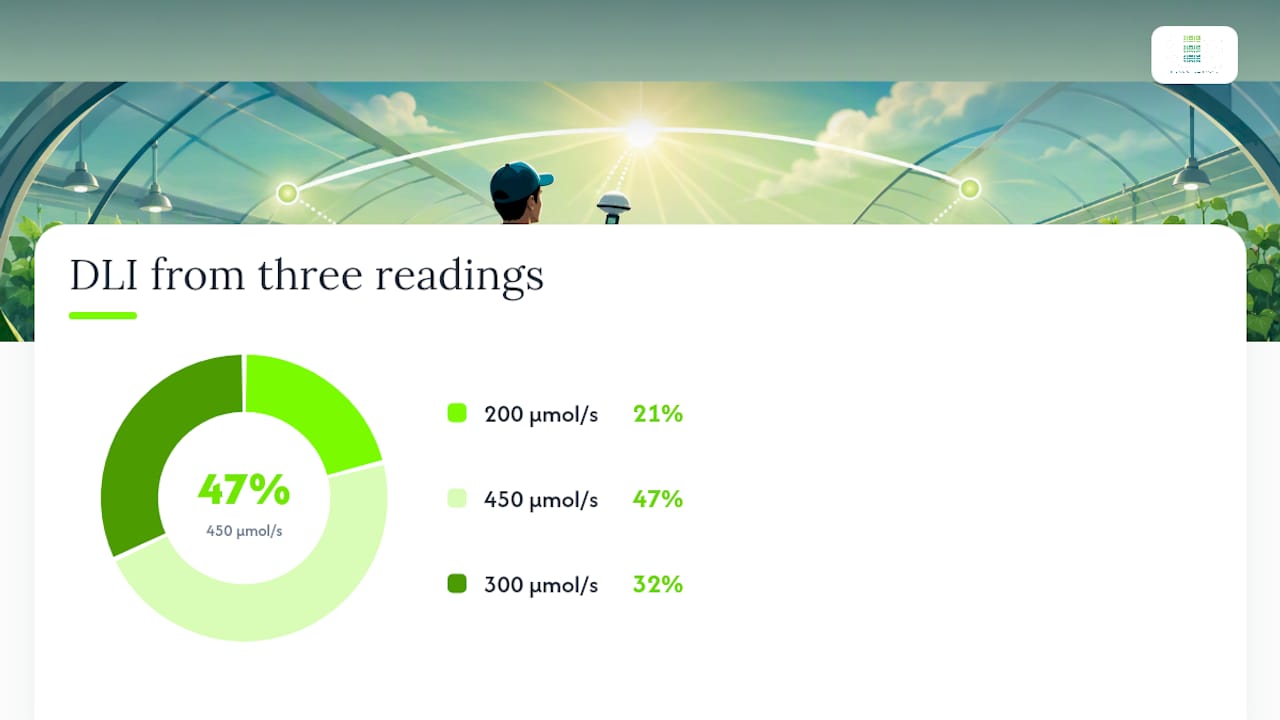
Here’s a simplified example using three readings at 30 minute intervals (1,800 seconds each):
Add those three and you get 1,710,000 µmol/m², which converts to 1.71 mol/m² for that 90-minute window alone. A full day’s log with hundreds of readings works the same way, just at scale.
Sensor placement matters as much as logging frequency. Set the sensor at canopy height, keep it level, and wipe the dome clean regularly, since dust and pollen buildup skews readings low.
Pro Tip: *Recalibrate your quantum sensor on the schedule the manufacturer recommends.
Growers often inherit foot-candle or lux data from older meters, and converting that into something useful for DLI calculations takes a specific multiplier. The base conversion, PPFD to DLI, is the same 0.0036 shorthand covered above. But when you’re starting from an hourly PAR average instead of instantaneous PPFD, Purdue Extension uses a 0.0864 multiplier, which accounts for a full 86,400 seconds in a day scaled to micromoles.
Foot-candle conversions require a source-specific multiplier because different lights emit different wavelength mixes, and a lux meter doesn’t distinguish between them.
| Light source | Foot-candles per µmol·m⁻²·s⁻¹ | Example: — |
|---|---|---|
| Sunlight | ≈0.2 | 5,000 × 0.2 = — |
| HPS | ≈0.13 | 5,000 × 0.13 = — |
Once you have that µmol/m²/s figure, run it through the standard formula to get DLI. The catch: these multipliers are approximations built from typical spectral output, and conversion factors vary between published sources depending on the exact fixture or sky condition measured. Treat lux-derived DLI numbers as estimates, not precise readings, and switch to a real quantum sensor whenever the crop’s value justifies it.
Your DLI number only matters once you compare it to what the plant actually needs, and that target shifts by crop type and growth stage. Extension guidance from Virginia Tech groups most crops into broad bands:
Stage matters as much as species. A seedling pushed too hard with a high DLI stretches or bleaches before its root system can support that growth rate, while the same crop in late flowering often benefits from the top of its range. Our DLI guide for indoor cannabis and high-light crops and the lettuce-specific breakdown both walk through exact stage transitions if you’re dialing in a specific crop rather than working from a general band.
The single most common mistake is a units error: forgetting to divide by 1,000,000 when converting micromoles to moles, or skipping the ×3,600 seconds conversion entirely. Both produce a number that’s off by orders of magnitude, and growers rarely catch it until yields don’t match the “target” they thought they hit.
A quick verification workflow catches most of this. Run a short log, an hour or two with your quantum sensor at canopy height, then compare the summed result against what a calculator predicts using your fixture’s rated output and photoperiod. If the two numbers are wildly different, the fixture’s real output at canopy is lower than its spec sheet claims, and that gap is exactly what you need to know before you plan a lighting schedule.
Pro Tip: *Run your verification check at three points across the canopy, not just center.
Once you know your target DLI, you have two levers: intensity and time. Raising PPFD from 500 to 700 µmol/m²/s on a 12-hour flowering schedule takes you from 21.6 to 30.24 mol/m²/day, while extending the photoperiod on the same fixture gets you there more slowly but with less heat load per hour. Which lever makes sense depends on your canopy’s tolerance for higher intensity and your room’s ability to manage the added heat.
Under-canopy fixtures solve a specific version of this problem: lower leaves and secondary bud sites often sit well below your target DLI even when the top canopy reads perfectly, because upper foliage shades everything beneath it. Adding under-canopy lighting raises DLI specifically at those shaded zones instead of just cranking overhead intensity and overexposing the top.
Plan your lighting schedule around DLI targets; use PPFD as your real-time canopy management tool. A midday PPFD spike or a cloudy afternoon dip doesn’t matter much if your daily total lands in range, but a consistently low PPFD reading warns you before the DLI shortfall shows up in growth. Shift your strategy seasonally outdoors, and lean on measured supplemental lighting indoors, since DLI correlates more directly with biomass and flowering than any single intensity reading. Get the formula right, and the target range for your crop tells you exactly what to fix.
— Scott
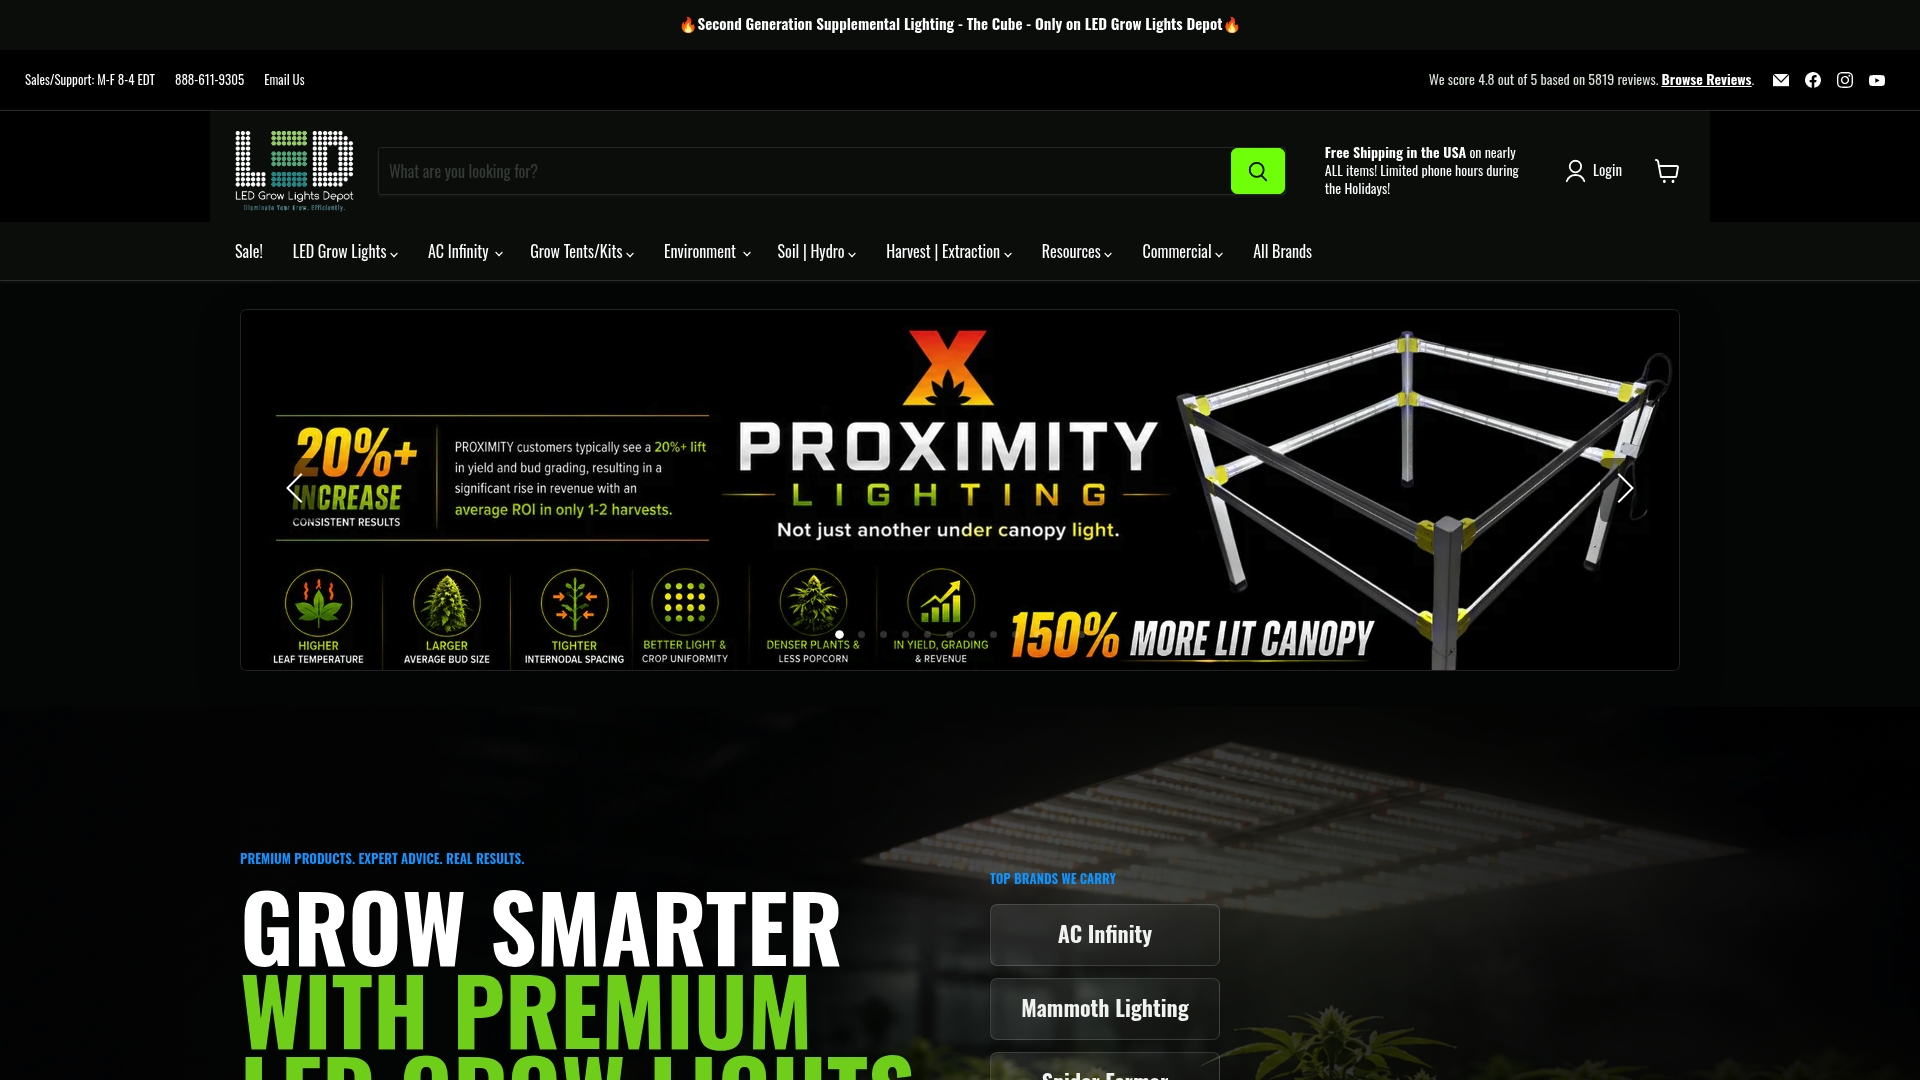
Once you know your target DLI, the fastest path to hitting it consistently is a fixture built to deliver even, measurable PPFD at canopy height rather than a spec sheet number that doesn’t hold up in the real tent. LedGrowLightsDepot’s proprietary proximity systems improve under-canopy light distribution specifically, which has translated to yield increases of over 20% and better bud grading for growers who were losing light at the lower canopy.
For growers pushing higher PPFD to close a DLI gap, the ThinkGrow LED Model-I and the higher-output Grower’s Choice ROI-E720 both deliver strong measured output at canopy rather than just on paper. If shaded lower bud sites are your actual DLI shortfall, our under-canopy lighting collection targets exactly that zone instead of overexposing the top. Measure your canopy PPFD first, run the formula, then browse fixtures sized to the gap you actually have.
Multiply PPFD (µmol/m²/s) by your photoperiod in hours, then by 3,600, then divide by 1,000,000. As a shortcut, multiply PPFD × hours × 0.0036, which gives you 400 µmol/m²/s over 16 hours as 23.04 mol/m²/day.
DLI is measured with a quantum sensor connected to a data logger that records PPFD at frequent intervals, ideally every 15 to 60 seconds. Each reading is treated as intensity times its time interval, summed across the day, then converted from µmol to mol by dividing by 1,000,000.
PPFD measures instantaneous light intensity in µmol/m²/s, essentially a snapshot. DLI measures the cumulative total of that light received over a full day in mol/m²/day, which correlates far more closely with actual plant growth and yield.
Place a calibrated quantum sensor at canopy height, keep it level and clean, and log readings continuously through the photoperiod. For steady LED or HPS lighting on a timer, you can skip logging and use the direct formula instead, since output stays constant across the schedule.
Target ranges run roughly 4 to 6 mol/m²/day for shade-tolerant plants up to 15 to 30+ for high-light flowering crops like tomatoes and cannabis. Check our cannabis and high-light crop DLI guide for stage-by-stage numbers rather than relying on a single blanket target.
0 of 3 items selected

Leave a comment