Free Shipping in the USA on nearly all items!
Limited phone hours during the Holidays! Call us: 888-611-9305
Free Shipping in the USA on nearly ALL items! Limited phone hours during the Holidays!

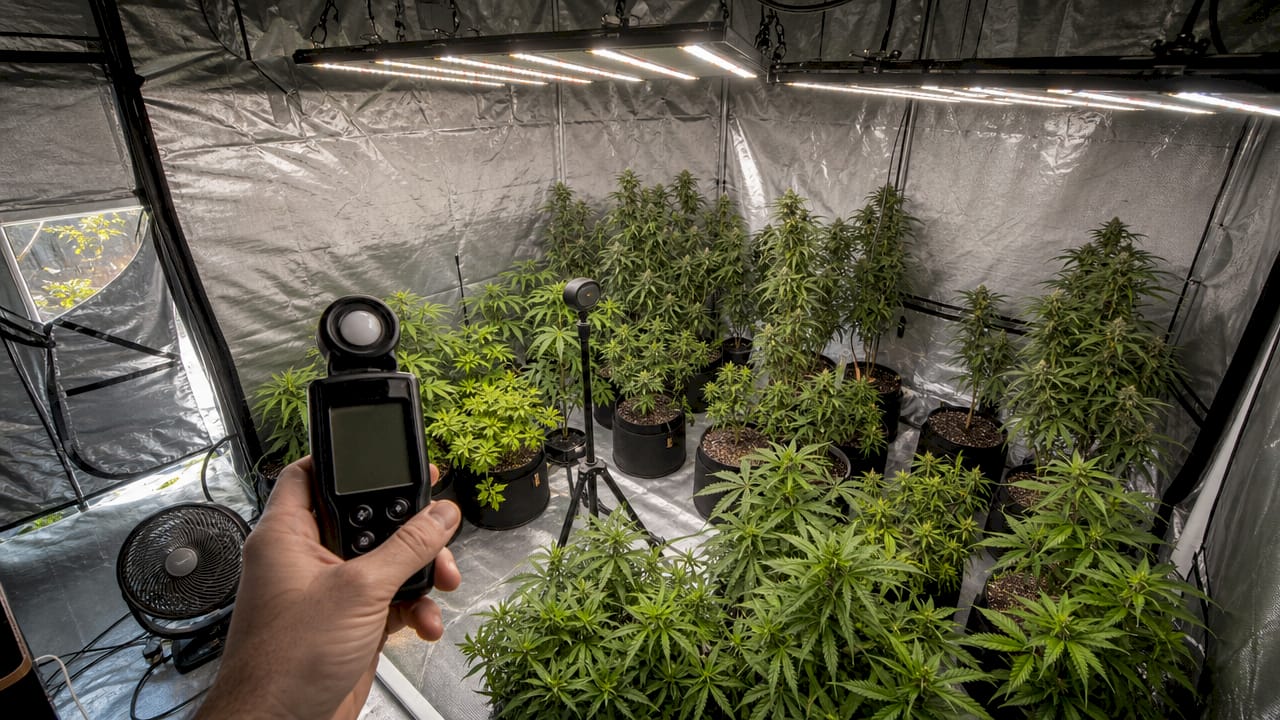
Grow room light mapping is the process of systematically measuring PPFD across a grid at canopy height to reveal exactly where light is strong, weak, or uneven. The industry standard term for this practice is PAR mapping or PPFD mapping. Every grower who relies on fixture specs alone is flying blind. Manufacturer ratings tell you how much light a fixture can produce. They do not tell you how that light actually lands on your plants. Light mapping closes that gap, giving you a spatial picture of real photon delivery so you can make layout decisions based on evidence, not assumptions.
Grow room light mapping measures photosynthetic photon flux density, or PPFD, at multiple points across your canopy. PPFD is reported in µmol/m²/s and represents the number of photons in the 400–700 nm PAR range hitting one square meter per second. The result is a point-by-point grid that shows you the actual light your plants receive, not the light your fixture is rated to produce.
The practical value is immediate. A map reveals hotspots where plants risk light stress and weak zones where growth stalls from insufficient photons. Without this picture, growers often compensate by running fixtures at higher intensity across the board, which wastes energy and can damage plants in the center while leaving edges underlit. Light mapping also validates or challenges manufacturer coverage claims, which describe illuminated space but say nothing about photon distribution quality.
For commercial cultivators, the stakes are higher. Uneven light distribution across a large canopy directly translates to uneven crop quality and inconsistent yields. For home growers, a simple map can reveal why one corner of a 4x4 tent consistently underperforms. The technique applies equally to both scales.
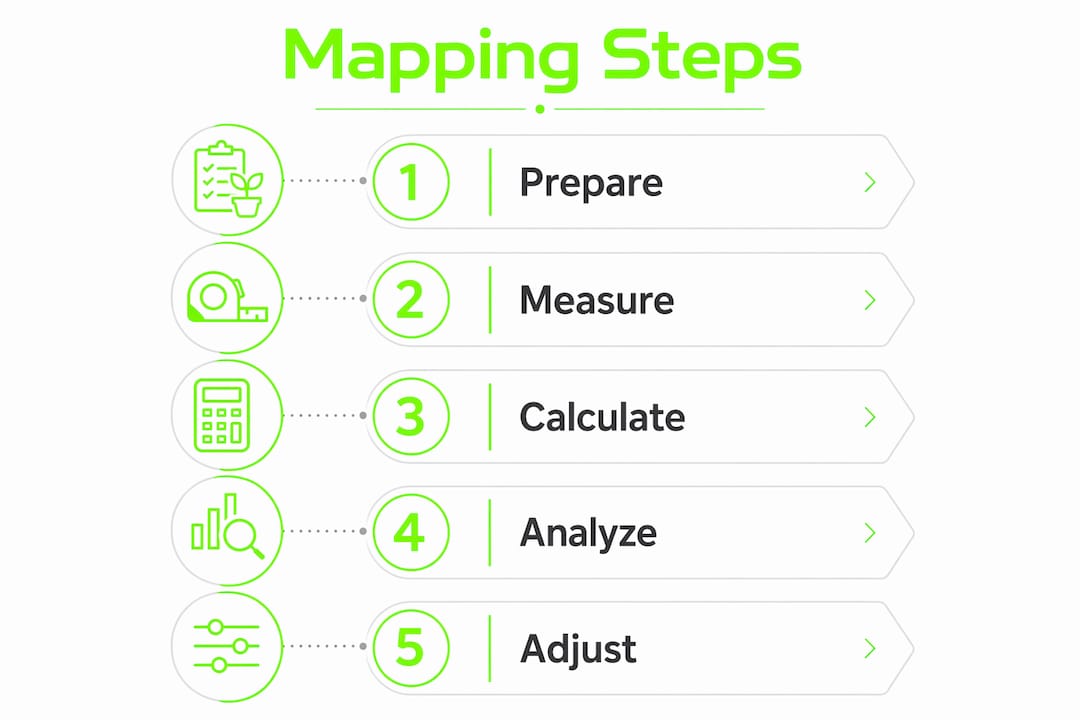
The workflow is straightforward. Accuracy depends on grid density, sensor quality, and where you take your readings.
Define your grid. A 3x3 to 5x5 evenly spaced grid is standard for most grow rooms. Larger spaces benefit from denser grids. Mark your grid points on the floor or on a canopy-height frame so measurements are consistent.
Set your sensor at canopy height. Every reading must be taken at the height where your plant tops sit, not at floor level or mid-room. Canopy height is where photons are actually absorbed.
Measure edges and corners. This step is where most growers cut corners, literally. Skipping edge and corner points causes you to overestimate uniformity. Edges and corners are almost always the weakest zones in any fixture layout.
Use a calibrated quantum sensor. Accurate PPFD mapping requires a quantum sensor calibrated for the 400–700 nm PAR range. Standard silicon photodiodes misread narrow-band LED spectra and produce unreliable data. Tools like the Apogee MQ-500 or the Photone app with a calibrated diffuser are widely used options.
Record every reading systematically. Log each point in a spreadsheet or grid diagram. Label rows and columns so you can reconstruct the spatial layout. A raw table of numbers is far more useful than a single average.
Calculate your average and identify outliers. Once all readings are recorded, find the mean PPFD, then flag any point that falls more than 20% below or above the average. Those outliers are your problem zones.
Pro Tip: Never map with lights that have just been switched on. Let your fixtures run for at least 15 minutes before taking readings. LED output stabilizes after a warm-up period, and early readings will be lower than actual operating output.
Raw numbers become useful only when you apply the right metrics. Two measurements matter most: the Uniformity Grid Ratio and the Coefficient of Variation.
The Uniformity Grid Ratio is the minimum PPFD divided by the average PPFD across all grid points. A ratio of 0.70–0.80 is acceptable for most crops. A ratio below 0.70 means your edge plants receive less than 70% of the average light, which is enough of a deficit to affect growth rate and bud quality. A ratio of 0.76 or above is a reliable working target for most flowering crops.
The Coefficient of Variation (CV) measures how spread out your readings are relative to the mean. A lower CV means more consistent light distribution. A CV above 20% signals significant unevenness that warrants fixture repositioning.
| Metric | Good | Acceptable | Poor |
|---|---|---|---|
| Uniformity Grid Ratio | 0.80 or above | 0.70–0.79 | Below 0.70 |
| Coefficient of Variation | Below 10% | 10–20% | Above 20% |
| Edge-to-center PPFD drop | Less than 15% | 15–25% | Above 25% |
Hotspots are the inverse problem. A center reading that is 40% above the average means plants directly under the fixture receive excess photons, which raises leaf temperature and can cause bleaching in sensitive strains. Edge fall-off and center hotspots often appear together in single-fixture setups, making multi-point mapping the only reliable diagnostic tool.
Pro Tip: Color-code your grid map using a spreadsheet conditional formatting tool. Green for readings within 10% of average, yellow for 10–25% deviation, and red for anything beyond 25%. The visual pattern shows problem zones instantly without any calculation.
Fixture coverage ratings describe the area a light can illuminate. They do not describe how photons are distributed within that area. Two fixtures with the same coverage area can produce very different PPFD gradients once installed, depending on optics, beam angle, and mounting height.
The most common misconceptions growers carry into a new setup:
The only way to know what your plants actually receive is to measure it yourself. Reviewing types of compact LED grow lights alongside their published PPFD maps gives you a starting point, but onsite measurement remains the final authority.
A completed light map is a decision-making tool. The data tells you exactly where to act.
Grow room light mapping is the only reliable method for confirming that your canopy receives consistent, sufficient light across every zone, not just at the center point under your fixture.
| Point | Details |
|---|---|
| Map with a calibrated sensor | Use a quantum sensor rated for 400–700 nm PAR to get accurate PPFD readings under LED spectra. |
| Include edges and corners | Skipping edge points overestimates uniformity and hides the zones most likely to underperform. |
| Target a 0.75+ Uniformity Grid Ratio | Readings below 0.70 indicate edge plants receive significantly less light than the canopy average. |
| Combine PPFD maps with DLI planning | Zone-level PPFD data reveals uneven daily light totals that average readings alone will not catch. |
| Remap after any layout change | Even minor fixture repositioning shifts uniformity metrics while average PPFD stays stable. |
I have seen setups where the average PPFD looked textbook perfect and the grower still struggled with uneven bud development. Every time, the map told the story the averages hid. One corner running at 55% of center PPFD. Two plants in the back row getting 30% less daily light than the front row. These are not edge cases. They are the norm in rooms designed around fixture specs rather than measured distribution.
The mistake I see most often, even from experienced growers, is mapping once at setup and never again. A single fixture shifted two inches during a cleaning session, a reflective wall panel replaced with a flat white one, a new fixture added without remapping the whole room. Each change alters the distribution in ways that are invisible without measurement. Frequent remapping is not obsessive. It is the only way to confirm your room still performs the way you set it up to perform.
My other strong opinion: do not trust any manufacturer PPFD map that does not disclose mounting height, grid density, and whether the test used a reflective environment. Those conditions change the numbers dramatically. Measure your own room under your own conditions. That is the only map that matters.
— Scott
Getting reliable light map data starts with the right fixtures and measurement tools. Ledgrowlightsdepot carries a range of LED grow lights with published PPFD data and known optical characteristics, giving you a credible starting point before you run your own measurements.
The NextLight 150h is a strong choice for growers who want a fixture with well-documented output characteristics that hold up under onsite verification. For cultivators running larger spaces, the ION 720W LED grow light delivers high-output performance suited to commercial canopy coverage. Ledgrowlightsdepot’s full catalog at ledgrowlightsdepot.com includes fixtures across output ranges, with a 4.8 out of 5 rating from more than 5,800 customer reviews backing the selection.
PPFD stands for photosynthetic photon flux density, measured in µmol/m²/s. It quantifies the photons in the 400–700 nm range hitting one square meter per second, which is the light plants actually use for photosynthesis.
A 3x3 to 5x5 grid is standard for most grow rooms, with readings taken at canopy height including all edges and corners. Denser grids produce more accurate uniformity analysis.
A ratio of 0.75 or above is a reliable working target for most flowering crops. Ratios below 0.70 indicate edge plants are receiving significantly less light than the canopy average.
Manufacturer PPFD maps are generated under controlled test conditions that may not match your grow room. Test conditions such as reflective walls, mounting height, and grid density all affect the numbers. Always verify with your own onsite measurements.
Remap after every fixture or layout change, even minor ones. Uniformity metrics shift significantly after repositioning while average PPFD may appear unchanged, making remapping the only reliable check.
{"one"=>"Select 2 or 3 items to compare", "other"=>"{{ count }} of 3 items selected"}

Leave a comment