
Free Shipping in the USA on nearly all items!
Limited phone hours during the Holidays! Call us: 888-611-9305
Free Shipping in the USA on nearly ALL items! Limited phone hours during the Holidays!

A 200-watt LED running 8 hours a day typically adds around $8 to $9 a month at average U.S. rates, while a 650-watt flowering fixture on the same schedule runs closer to $30 to $45 depending on your utility’s rate. The formula behind every number in this guide is simple: kWh/day = (watts ÷ 1,000) × hours/day, then cost = kWh × your $/kWh. Measure actual wall draw, not the marketing wattage on the box, and the math holds for any fixture you own.
TL;DR:
- Running a 200-watt LED fixture for eight hours costs about $8 to $9 monthly at average U.S. rates, but a 650-watt fixture for the same schedule can exceed $40.
- To accurately estimate costs, measure actual wall draw with a wattmeter and consider fixture efficiency, dimmer settings, and local utility rates, especially if peak or off-peak rates differ.
- High-efficacy LED fixtures that deliver the same canopy PPFD can halve energy use compared to legacy high-wattage HPS lights, reducing both power consumption and heat-related cooling costs.
- Demand charges in commercial setups can significantly increase costs if fixtures start simultaneously, so staggering startup times and reducing peak load can help lower bills.
- Seasonal changes and time-of-use rates cause monthly grow light costs to fluctuate, with winter and summer often incurring higher expenses due to reduced natural light and increased HVAC loads.
Building a grow light electricity cost calculator takes six inputs. Get these right and the output matches your utility bill within a few percent.
The single-rate formula is: kWh/day = (watts × fixtures × dimmer fraction × hours) ÷ 1,000. Multiply that by your $/kWh to get daily cost, then by 30 for a monthly figure and by 365 for annual. If your utility bills peak and off-peak separately, split your daily hours into each band and calculate the two segments independently before adding them together, since running lights during off-peak windows can meaningfully undercut a single blended rate.
Use a plug-in wattage meter to confirm actual draw. Fixtures rarely pull exactly their rated wattage, and dimmed units draw less than their max spec. This single step, backed by calculator methodology at Starlight Tools, fixes more estimate errors than any other adjustment. Once you have a daily kWh figure, scale it to 30 days and reconcile against your actual bill to catch measurement drift early.
Numbers get concrete fast once you plug real wattages into the formula. Here’s how four common setups shake out across low, average, and high electricity rates.
At $0.17/kWh, a 200-watt fixture running 8 hours a day lands right around $8 to $9 per month, matching the low end of most home setups. A 650-watt flowering fixture at 12 hours pulls close to 234 kWh monthly, a scale where DLI targeting matters as much as raw cost.
For a DLI cross-check: a fixture delivering 800 µmol/m²/s of PPFD across a 12-hour photoperiod produces a DLI of roughly 34.6 mol/m²/day (PPFD × hours × 0.0036). That’s well inside the target range for most flowering crops without adding a single extra hour of runtime.
None of these figures include fans, dehumidifiers, or air conditioning. Those loads often add 30% to 40% more to your total grow-room electricity footprint, so treat the lighting number as a floor, not the ceiling.
Watts alone tell you almost nothing about what a fixture actually delivers. Two fixtures pulling 650 watts can produce very different amounts of usable light, and that gap is where real savings or waste hide.
Swapping a legacy 1,000W HPS for a high-efficacy LED delivering the same canopy PPFD commonly cuts direct energy use by roughly half, and the Fytech Systems ROI modeling for vertical farms shows the bigger win often shows up in reduced HVAC load, since HPS fixtures dump far more waste heat into the room. Always compare average canopy PPFD, not the peak center reading, when judging two fixtures against each other. A fixture with excellent center PPFD but weak edge coverage forces you to run more units, or run longer, to hit the same DLI across the whole canopy.
Cutting your bill without cutting yield comes down to a handful of levers, and most growers only ever touch one of them.
Pro Tip: Test one change at a time, and compare kWh from your actual meter across the same number of billing days before and after. Changing dimmer settings and photoperiod in the same week makes it impossible to tell which adjustment actually moved the needle.
Every input in the formulas above gets easier to trust when the fixture specs behind them are transparent. LedGrowLightsDepot backs its lineup with a 4.8 out of 5 rating across more than 5,800 customer reviews, built on proprietary under-canopy proximity lighting that improves light penetration and has been tied to yield increases over 20% in real growing setups.
For readers who want to go deeper on the light-metric side of these calculations, the PPFD per watt guide and the PAR, PPF, PPFD, and DLI primer break down exactly how fixture specs translate into what shows up on your utility bill.
The math almost always favors the higher-efficacy fixture over a full grow cycle, but the payback period depends heavily on how many hours you run and your local rate. A fixture with better µmol per joule performance costs more upfront, sometimes by several hundred dollars, but every month of operation compounds the electricity savings against a less efficient unit.
Run the comparison against your own numbers before assuming the premium fixture wins. Take the wattage difference between two fixtures rated for similar canopy PPFD, multiply by your hours per day and $/kWh, and you’ll get a monthly savings figure. Divide the price difference between the two fixtures by that monthly savings to find your break-even point in months. For commercial growers running fixtures 12 or more hours a day across multiple rooms, that break-even often lands well inside a single growing season.
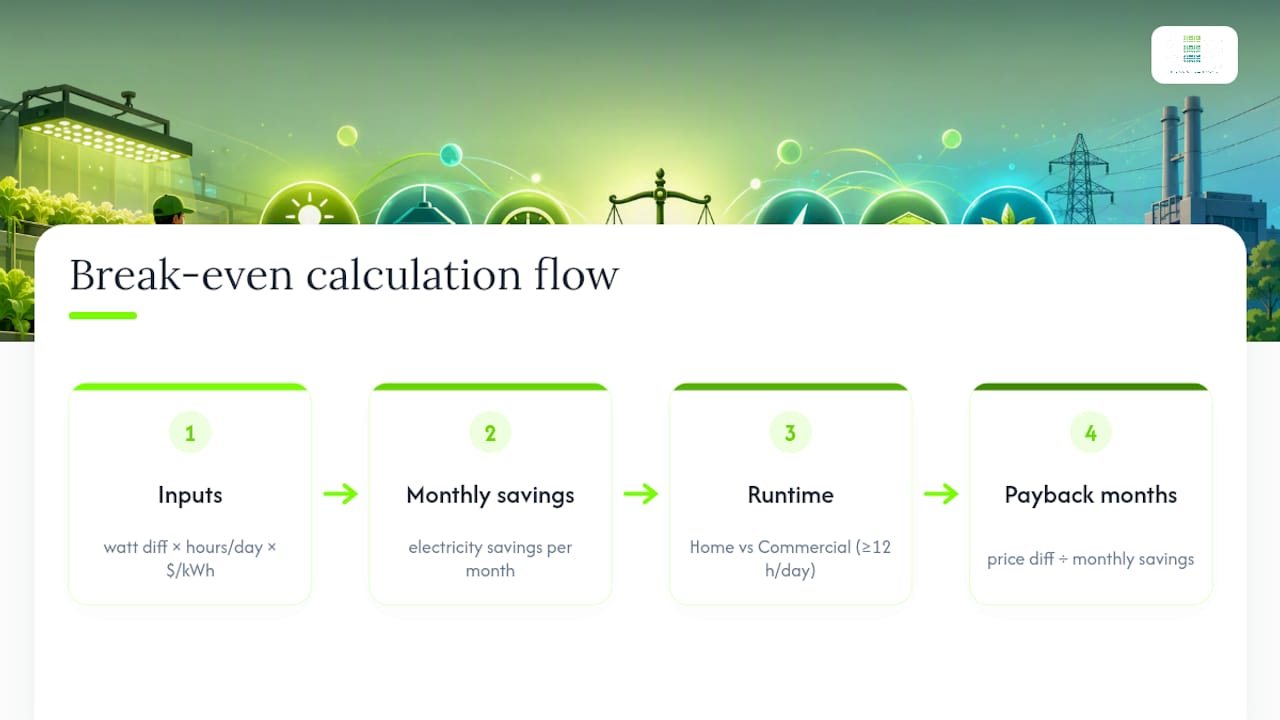
Energy-only comparisons tend to understate the real advantage, though. ROI modeling for vertical farm retrofits shows that factoring in reduced HVAC load, lower fixture depreciation, and less maintenance downtime consistently improves payback timelines beyond what a simple watt-for-watt electricity comparison suggests. A fixture that also runs cooler reduces strain on your air conditioning, and that savings rarely shows up if you only look at the light’s own power draw. Depreciation matters too. Fixtures with longer rated lifespans push replacement costs further out, which changes the total cost of ownership even when two units carry an identical sticker price at purchase.
Your $/kWh rate is not a fixed national number. It varies by state, by utility, and often by season, which is why the EIA’s electricity monthly data tables exist as a reference point rather than a single figure you can apply everywhere.
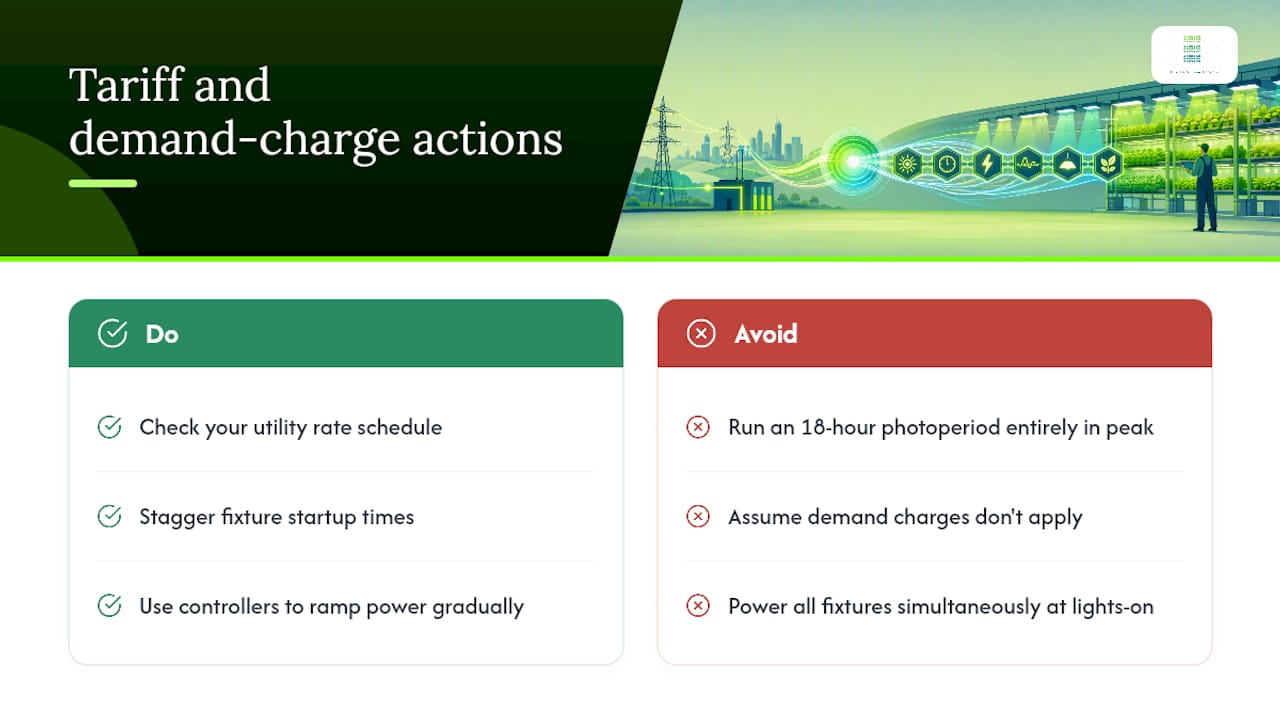
Residential rates alone can differ by a wide margin between states, and even within a single utility territory, time-of-use plans can price electricity differently depending on the hour of the day. Running an 18-hour vegetative photoperiod entirely inside a utility’s peak pricing window, when a small schedule shift could push several of those hours into an off-peak band, is one of the most common unforced errors home growers make.
Commercial cultivators face an added layer: demand charges. Unlike residential billing, which almost always charges strictly for total kWh consumed, many commercial and some larger residential rate structures add a separate fee tied to your single highest kilowatt draw during the billing period. A room where every fixture powers on simultaneously at lights-on can spike that peak demand reading, even if the total monthly kWh stays modest. Staggering fixture startup times by a few minutes each, or using controllers that ramp power gradually, can meaningfully reduce that peak without changing total energy use at all. Check your utility’s specific rate schedule before assuming a demand charge applies, since not every plan includes one.
Your electricity cost tied to lighting shifts with the calendar, even if your indoor setup never changes. Shorter daylight hours in fall and winter push many growers to lean harder on supplemental or full-spectrum indoor lighting to hit the same DLI targets, since less natural light reaches windows or greenhouse structures during those months.
Growers using greenhouses or light-assisted setups often see their grow light electricity cost rise in winter for exactly this reason. Purely indoor setups running under blackout conditions don’t see this natural-light effect, but they often see something else: HVAC costs that swing with the season. Summer cooling loads climb when a grow room’s own heat output stacks on top of already-warm ambient temperatures, and that added air conditioning draw belongs in your total cost picture even though it’s not technically a lighting expense.
Utility rates themselves can also shift seasonally. Many utilities set higher per-kWh rates during summer peak demand months, which means the exact same lighting schedule can cost more in July than in January purely because of the rate, not the runtime. Reviewing your billing rate schedule each season, rather than assuming a flat $/kWh year round, keeps your cost estimates accurate as the calendar turns.
The most common mistake in this hobby isn’t overspending on electricity. It’s optimizing the wrong variable entirely. Growers fixate on watts, compare fixtures by wattage alone, and end up buying more light than their canopy can actually use, then wonder why their bill climbed without a proportional yield increase.
The fix isn’t complicated, but it does require a mental shift: think in DLI, not watts. A fixture that hits your target DLI with a lower wattage and better canopy uniformity beats a higher-wattage fixture running under-dimmed to compensate for poor light distribution, every time, on both the electricity bill and the harvest.
Conventional grow-light advice treats efficiency comparisons and cost calculators as separate exercises. They shouldn’t be. The whole point of knowing your PPE and PPFD numbers is to plug them straight into the same kWh formula you use for your utility bill, so you’re comparing fixtures on cost-per-DLI rather than cost-per-watt. That’s the calculation that actually predicts what you’ll pay and what you’ll harvest.
If you take one thing from this guide, prioritize the wall-draw meter over the spec sheet. Marketing wattage numbers get rounded, inflated, or quietly redefined as “equivalent” output. A ten-dollar plug meter tells you the truth every single month.
— Scott
LedGrowLightsDepot gives you the fixture specs upfront so you can run the exact math in this guide before you buy, not after. The Grower’s Choice ROI-FF 650W is built for 4x4 flowering rooms where canopy PPFD and real wattage draw need to line up with what you calculated above, and the Grower’s Choice ROI-E720 covers 3.5x3.5 to 4x4 spaces for growers who want high efficacy without oversizing their setup.
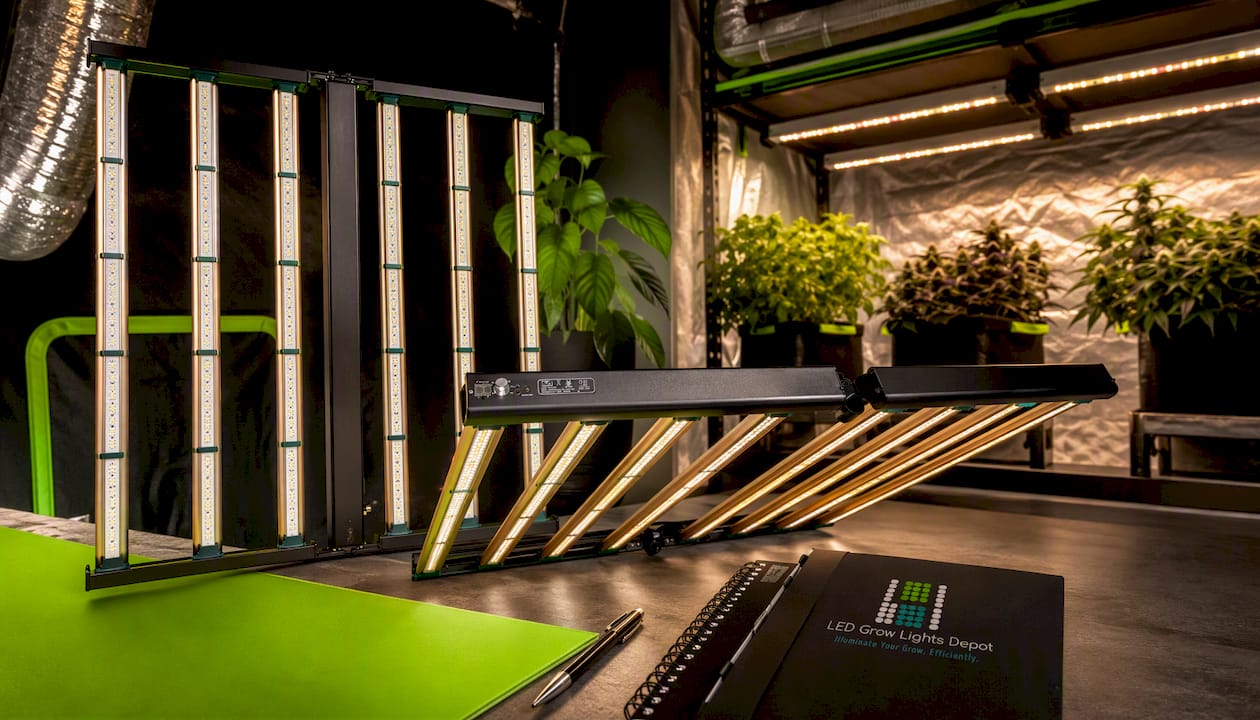
Product pages list specs needed to plug straight into the calculator formulas covered here: rated wattage, PPF, and efficacy. Measure your current fixture’s wall draw with a plug meter and compare it against these specs for a tailored run-cost estimate based on your room size, photoperiod, and local utility rate.
The rate ranges and formulas in this guide draw on a small set of sources worth bookmarking if you want to build your own calculator or verify these numbers against your situation.
It depends on wattage and hours run, but a typical 200 to 650-watt LED running 8 to 12 hours a day usually costs between $8 and $45 a month, well below a comparable HPS fixture at the same footprint.
Multiply watts by hours per day, divide by 1,000 to get daily kWh, multiply by 30 for monthly kWh, then multiply by your $/kWh rate. A 200-watt LED at 8 hours daily runs about $8 to $9 a month at average U.S. rates.
At 12 hours a day and an average rate near $0.17/kWh, a 1,000-watt HPS fixture costs roughly $61 a month, and closer to $86 a month at higher regional rates.
A 1,000-watt fixture running 12 hours a day uses 12 kWh daily (1,000 watts ÷ 1,000 × 12 hours). Electricity cost depends on your local rate and additional equipment like fans or AC.
0 of 3 items selected


Leave a comment