Free Shipping in the USA on nearly all items!
Limited phone hours during the Holidays! Call us: 888-611-9305
Free Shipping in the USA on nearly ALL items! Limited phone hours during the Holidays!

Grow light spectrum is defined as the range of light wavelengths your plants can absorb and convert into energy for growth. To understand grow light spectrum basics, you need to know that plants respond to Photosynthetically Active Radiation, or PAR, which spans 400–700 nanometers. This range covers the blue, green, and red wavelengths that drive photosynthesis and shape how your plants develop. Modern LED grow lights, measured by metrics like PPFD and DLI, let you deliver the right spectrum at every growth stage. Getting this right is the difference between plants that survive and plants that thrive.
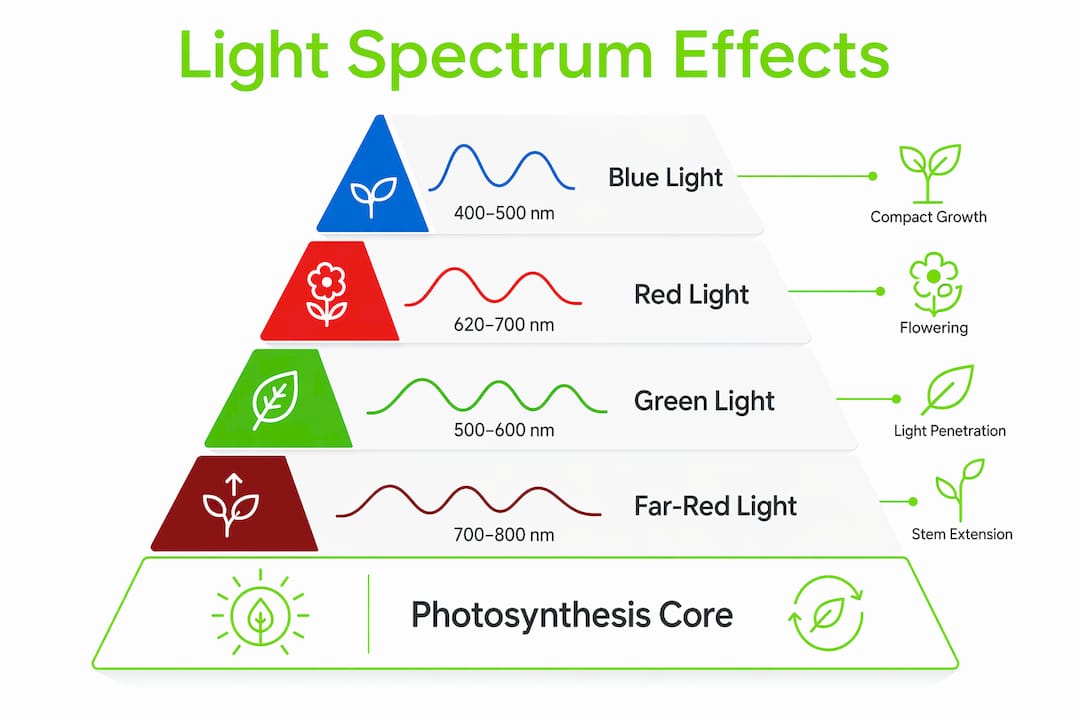
The grow light spectrum explained simply is this: different wavelengths do different jobs. Blue, red, green, and far-red light each trigger specific responses in your plants, and knowing which does what gives you real control over your grow.
Blue light drives compact, stocky growth with thicker leaves and higher chlorophyll content. Photoreceptors called cryptochromes and phototropins absorb blue wavelengths, regulating stomatal opening and pigment production. This makes blue light critical during the seedling and vegetative stages. Without enough blue, plants stretch toward the light and produce weak, spindly stems.
Red light is the primary driver of photosynthesis efficiency and flowering. Peak performance sits near 660 nm, where chlorophyll absorption is highest. Red light drives biomass accumulation and triggers the flowering response in photoperiod-sensitive plants. If you are growing tomatoes, cannabis, or any fruiting crop, red light intensity during bloom is non-negotiable.
Green light (500–570 nm) penetrates deeper into the canopy than blue or red, reaching shaded lower leaves and boosting their photosynthetic output. Far-red light, just beyond 700 nm, influences flowering timing and leaf expansion through phytochrome-mediated responses. Red-to-far-red ratios affect internode elongation and canopy architecture. Manipulating far-red can speed up or delay flowering, which is a useful tool for experienced growers.
Here is a quick reference for how each wavelength range functions:
| Wavelength Range | Color | Primary Plant Effect |
|---|---|---|
| 400–500 nm | Blue | Compact growth, chlorophyll production, stomatal control |
| 500–570 nm | Green | Canopy penetration, shaded leaf photosynthesis |
| 600–700 nm | Red | Biomass accumulation, flowering, peak photosynthesis |
| 700–750 nm | Far-red | Flowering timing, leaf expansion, shade response |
Pro Tip: Avoid old-style red-blue “blurple” LEDs. Balanced white-spectrum LEDs outperform them for growth outcomes and make it far easier to spot pest damage or nutrient deficiencies under your lights.
Human lighting metrics like lumens, lux, and Kelvin measure how bright light appears to the human eye. They do not reflect how useful that light is to a plant. Lumens and lux ignore the red and blue wavelengths plants rely on most, making them useless for grow light decisions.
The two metrics that actually matter are PPFD and DLI.
PPFD (Photosynthetic Photon Flux Density) measures the number of photons hitting your plant canopy per second, expressed in µmol/m²/s. Think of it as the instantaneous intensity reading at canopy level. Seedlings need a PPFD of 200–400 µmol/m²/s. Flowering plants need 800–1,200 µmol/m²/s.
DLI (Daily Light Integral) sums the total photons your plant receives over a full day. DLI is calculated from PPFD multiplied by the number of seconds your light runs, then divided by one million. A plant getting moderate PPFD for 18 hours can accumulate the same DLI as one getting high PPFD for 12 hours. This matters because plant development correlates with total daily photon exposure, not just peak brightness.
| Metric | What It Measures | Useful for Plants? |
|---|---|---|
| Lumens / Lux | Brightness perceived by human eyes | No |
| Kelvin | Color temperature of light source | No |
| PPFD (µmol/m²/s) | Photon intensity at canopy per second | Yes |
| DLI (mol/m²/day) | Total daily photon dose received | Yes |
Typical photoperiods run 12–18 hours depending on plant stage. Leafy greens and herbs do well at 14–16 hours. Flowering plants often need a strict 12-hour dark period to trigger bloom.
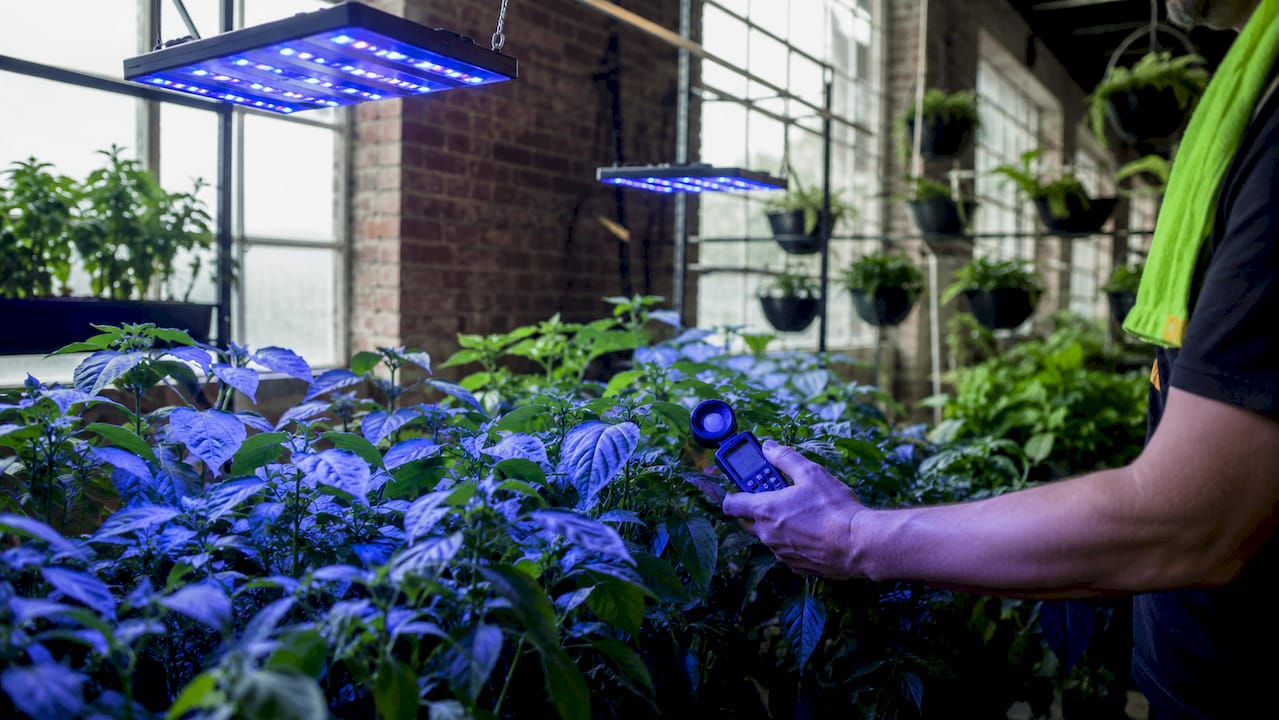
Pro Tip: Use a PAR meter or a PPFD app to measure actual canopy intensity rather than trusting the manufacturer’s coverage claims. Light intensity drops sharply with distance, so your real numbers may differ from the spec sheet.
A spectral power distribution (SPD) chart shows how much light a fixture emits at each wavelength across the PAR range. SPD charts reveal the true composition of a light’s output, including its red-to-blue ratio and far-red fraction. This is the only reliable way to compare two grow lights beyond marketing claims.
When reading an SPD chart, look for these key indicators:
The phrase “full spectrum” on a product label means very little on its own. “Full spectrum” is a marketing term without regulatory definition. Always request or download the SPD chart before buying. If a manufacturer will not provide one, that tells you something.
| Spec to Check | What to Look For | Red Flag |
|---|---|---|
| Efficacy (µmol/J) | 2.0 or higher | Below 1.5 µmol/J |
| SPD chart available | Yes, with wavelength data | “Full spectrum” label only |
| PPFD map provided | Coverage at target height | Single-point center reading |
| Far-red fraction | Small peak near 730 nm | Completely absent |
Understanding light for plants at this level separates growers who get consistent results from those who keep chasing problems.
Practical setup is where spectrum knowledge pays off. Here is a step-by-step approach to getting your lighting right from day one.
Choose a fixture rated above 2.0 µmol/J. Efficiency matters for your electricity bill and for light output quality. The types of grow light spectrums available today range from single-band LEDs to broad white-spectrum fixtures. For most home growers, a quality full-spectrum LED is the right starting point.
Set PPFD targets by growth stage. Seedlings and clones need 200–400 µmol/m²/s. Vegetative plants perform well at 400–600 µmol/m²/s. Flowering crops need 800–1,200 µmol/m²/s for peak output. Herbs and greens sit comfortably at 250–350 µmol/m²/s.
Calculate your DLI target and set your photoperiod. A leafy green needing a DLI of 17 mol/m²/day at 300 µmol/m²/s needs roughly 15–16 hours of light. Use the formula: DLI = PPFD × photoperiod in seconds ÷ 1,000,000.
Position your light for uniform canopy coverage. Most LED fixtures have a recommended hanging height in their PPFD maps. Follow it. Lights hung too close create hot spots. Lights hung too far reduce intensity below your target.
Adjust spectrum or intensity as plants develop. Some fixtures let you dial up red output during flowering or reduce intensity for seedlings. If yours does not, adjust hanging height to hit your PPFD target for each stage.
Pro Tip: Run your lights on a timer from day one. Consistent photoperiods matter as much as spectrum. A plant that gets 14 hours one day and 10 the next will not perform as well as one on a locked 16-hour schedule.
Consistent DLI and correct PPFD targets matter more than chasing specific color ratios, making spectrum knowledge a practical tool rather than just theory.
| Point | Details |
|---|---|
| PAR is the usable range | Plants use light from 400–700 nm; stay within this range for effective growth. |
| PPFD and DLI are your real metrics | Ignore lumens and Kelvin; measure photon intensity and daily totals instead. |
| Each wavelength has a role | Blue builds structure, red drives flowering, green penetrates canopy, far-red shapes timing. |
| Read SPD charts, not labels | “Full spectrum” labels are unregulated; always check the spectral power distribution data. |
| Efficacy above 2.0 µmol/J | Choose fixtures that convert electricity to plant-usable light efficiently. |
I spent years chasing the “perfect” spectrum ratio before realizing that most home growers overcomplicate this. The science is real: blue builds structure, red drives flowering, and far-red shapes timing. But in practice, a quality full-spectrum LED delivering consistent DLI at the right PPFD will outperform a precisely tuned narrow-band setup run inconsistently.
The biggest shift in my results came when I stopped adjusting spectrum and started obsessing over DLI. Once I locked in the right daily photon dose for each crop, growth became predictable. Tomatoes hit their targets. Herbs stayed compact. Flowering plants hit peak bud density without any spectrum tweaking.
The other thing I tell every home grower is this: use white-spectrum LEDs. Broad-spectrum white LEDs let you actually see your plants under normal-looking light. Spotting a spider mite infestation or a magnesium deficiency under a blurple light is genuinely difficult. Under white light, problems are obvious. That alone has saved more crops than any spectrum optimization I have ever done.
Experiment with your setup. Measure your PPFD. Track your DLI. The science gives you a framework, but your specific grow space, your specific plants, and your specific fixtures will always have their own quirks. Let the data guide you, not the marketing.
— Scott
Knowing your spectrum is only half the equation. The other half is having a fixture that actually delivers it.
Ledgrowlightsdepot carries a full range of full-spectrum LED grow lights built for home growers and commercial cultivators alike. Every fixture in the catalog is rated above 2.0 µmol/J, so you are not wasting electricity on heat instead of photons. For growers who want precise DLI control, the TrolMaster Hydro-X DLI adapter lets you automate your photoperiod and intensity scheduling down to the minute. With over 5,800 customer reviews averaging 4.8 out of 5, Ledgrowlightsdepot has the products and the expertise to match your spectrum knowledge to the right hardware.
The PAR range is 400–700 nm. This is the portion of the light spectrum plants use for photosynthesis and growth.
Seedlings need 200–400 µmol/m²/s. Flowering plants require 800–1,200 µmol/m²/s for peak biomass and bud development.
No. “Full spectrum” is an unregulated marketing term. Always request the spectral power distribution chart to verify actual wavelength output before purchasing.
Multiply your PPFD reading by your photoperiod in seconds, then divide by 1,000,000. Leafy greens typically need a DLI of 12–20 mol/m²/day depending on the crop.
Not with a quality full-spectrum LED. A single fixture rated above 2.0 µmol/J covers both stages. Adjust hanging height or dimmer settings to hit the correct PPFD target for each stage.
{"one"=>"Select 2 or 3 items to compare", "other"=>"{{ count }} of 3 items selected"}


Leave a comment